Utilities Menu
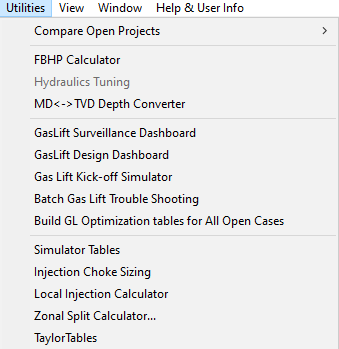
The Utilities menu offers the following commands:
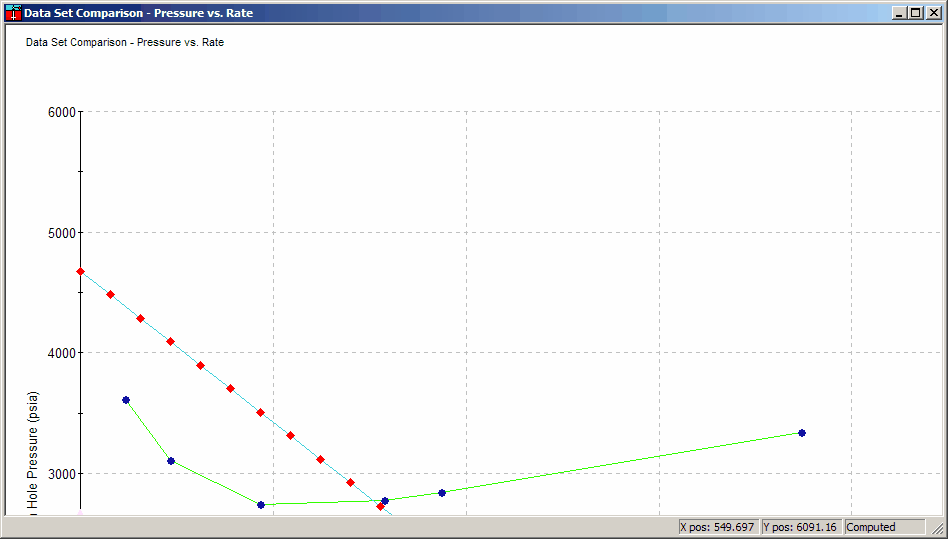
- Compare Open Projects: Compare Nodal Analysis, IPR Results, and Hydraulic Results for all currently open data sets.
- Build Simulator Tables: Build Eclipse, VIP, and PSIM hydraulics tables.
- Zonal Splits Calculator: Perform quick zonal splits calculations.
- Local Injection: Perform quick local injection calculations.
- Hydraulics Tuning: Perform quick hydraulics tuning calculations.
- Batch Gas Lift Troubleshooting: Run large scale gas lift troubleshooting. Available to database enabled users.
- FBHP Calculator: Calculate flowing bottom hole pressure.
- GasLift Surveillance Dashboard: Expert GasLift surveillance utility.
- GasLift Design Dashboard: Expert GasLift mandrel spacing and valve design dashboard.
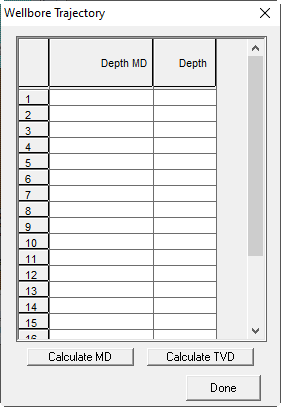
- MD ↔ TVD Depth Converter: Convert MD to TVD and vice versa based on the wellbore description.
1. Compare Data Sets
The following data sets are comparable:
-
Hydraulics Curves
-
IPR Curves
-
Nodal Analysis Plots
1.1. Hydraulics Curves
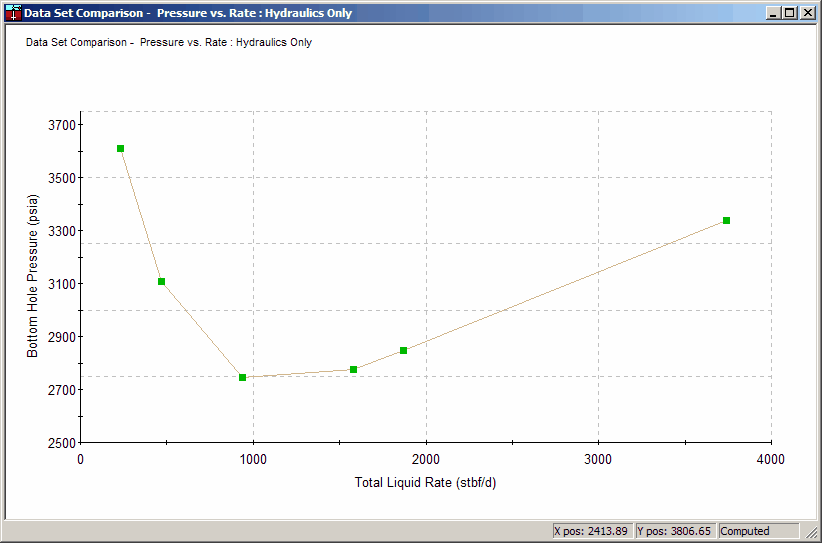
To Access:
Utilities Menu -> Compare Open Projects -> Compare Hydraulics Plots
1.2. IPR Curves
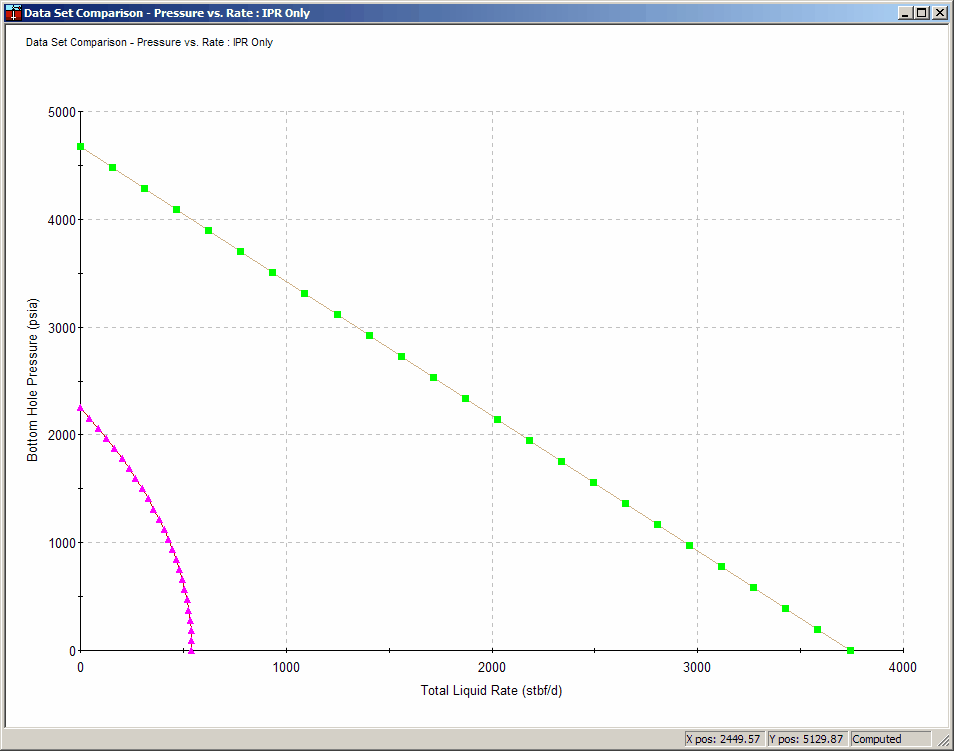
To Access:
Utilities Menu -> Compare Open Projects -> Compare IPR Plots
1.3. Nodal Analysis Plots
To Access:
Utilities Menu -> Compare Open Projects -> Compare Nodal Plots
2. Flowing Bottomhole Pressure Analyzer
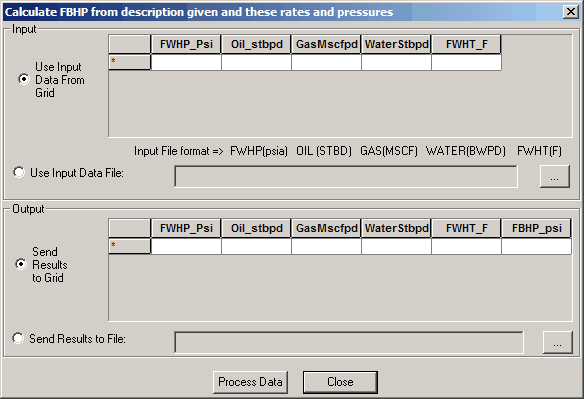
To Access:
Utilities Menu -> FBHP Calculator
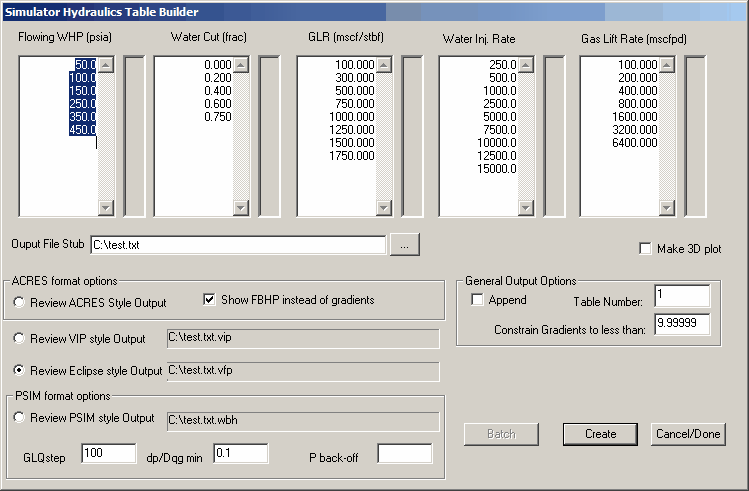
3. Build Simulator Input Tables

Optional 3D Plot
If “Make 3D plot” is checked, a 3D plot is generated in addition to the tables.
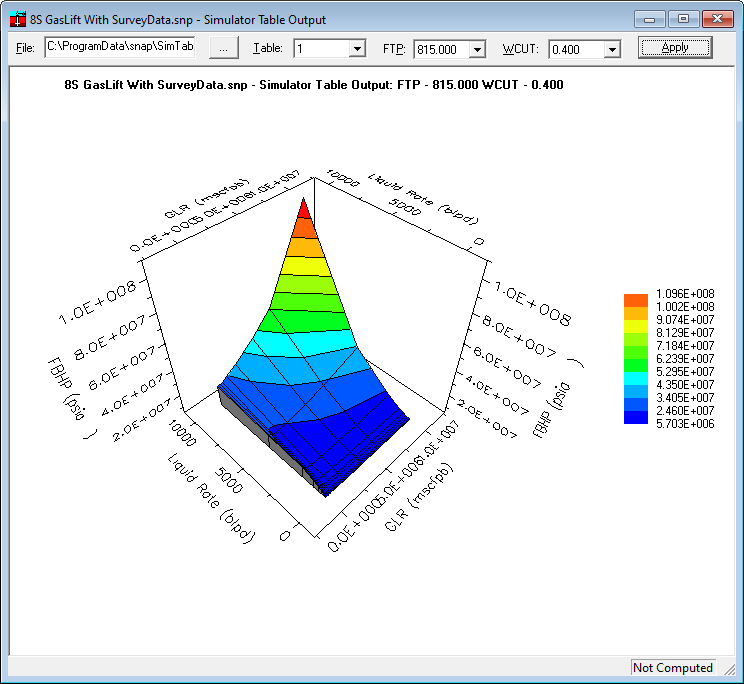
3.1. 3D Chart
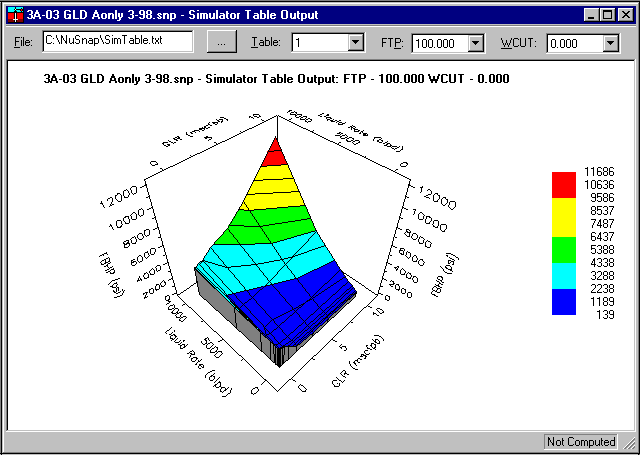
To create
Utilities Menu -> Simulator Tables
4. Batch Gas Lift Troubleshooting
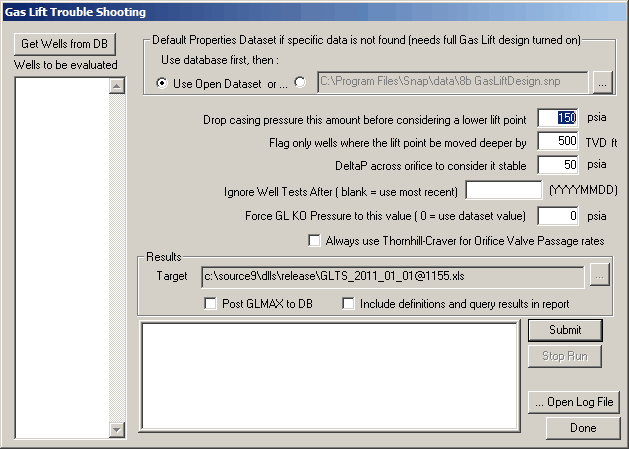
Overview
Evaluates database-configured wells for specific behaviors or problems and builds a customizable tabular report.
To Access:
Utilities Menu -> Batch Gas Lift Troubleshooting
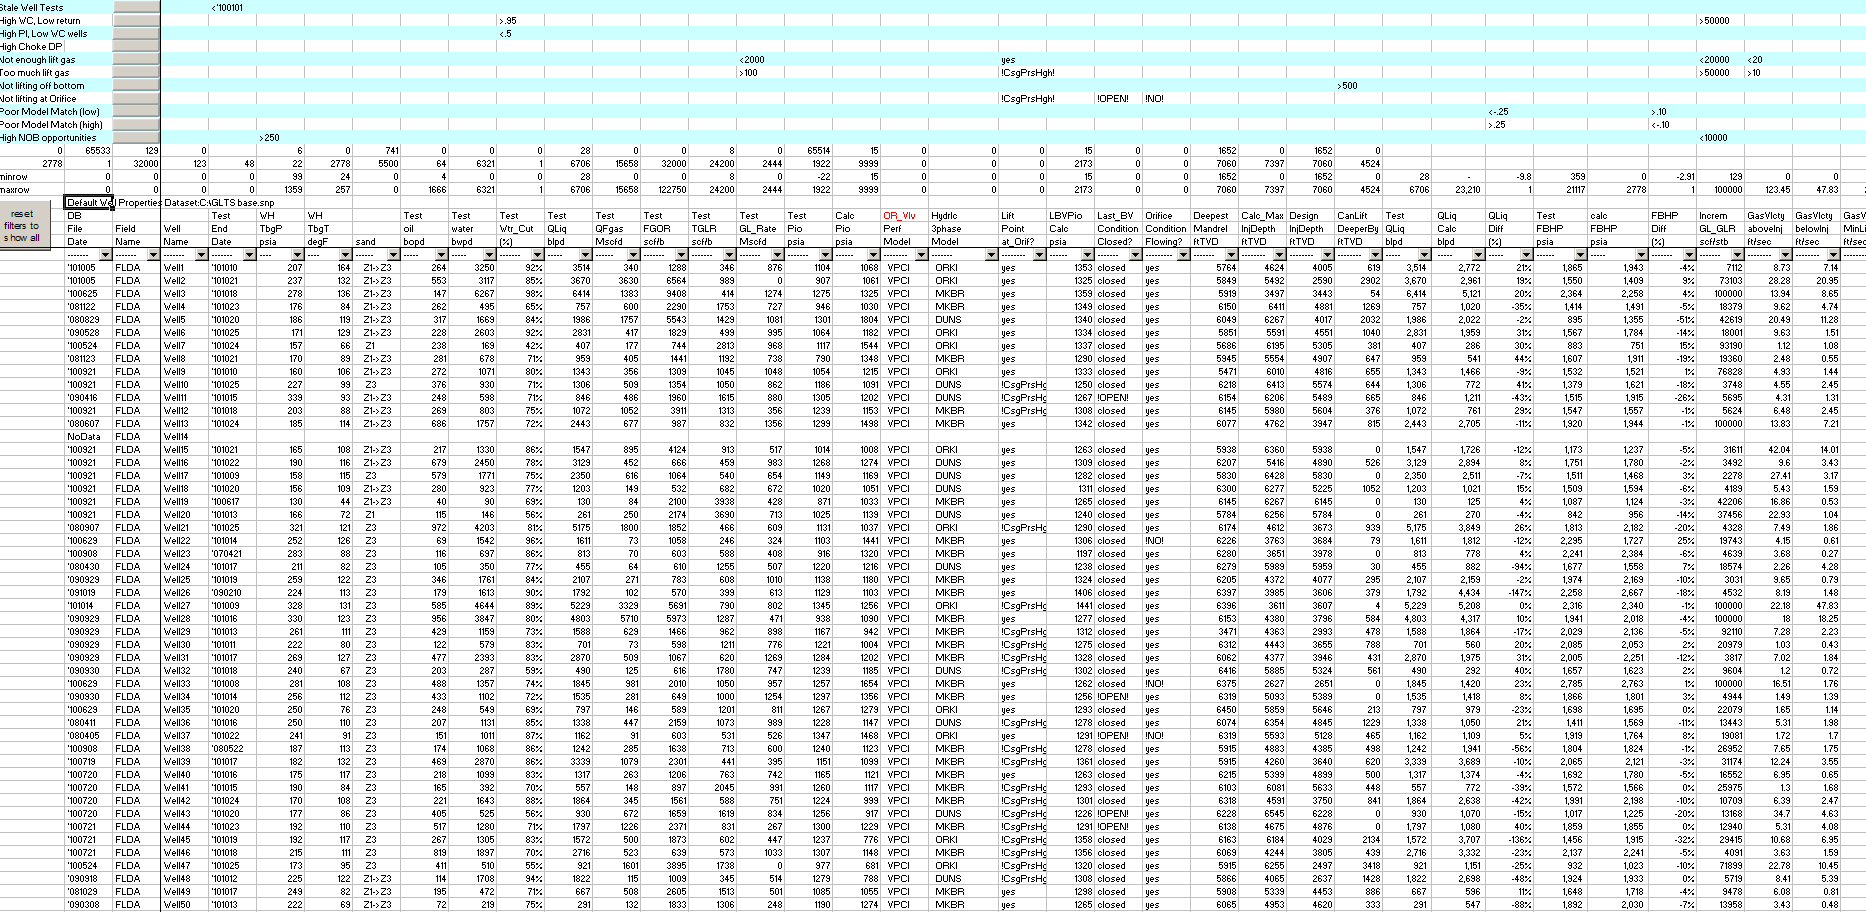
4.1. Report columns
-
Database File Date
Lists the date of the most recent transfer from System Nodal Analysis Program (SNAP) to the Technical Data Base. The wells database dataset is updated with SNAP values for PVT properties, reservoir data, wellbore description, gas passage method, hydraulics 3 phase model correlation, global preferences, and more. -
Field Name
Field associated with the well. -
Well Name
Name of the well in the Technical Data Base. Specifies the main wellbore and does not identify laterals. -
Test End Date
Date of the last allocated and or good well test used in the Batch GLTS routine. -
WH TbgP psia
Flowing wellhead tubing pressure measured during the well test. -
WH TbgT deg_F
Flowing wellhead tubing temperature measured during the well test. -
sand
Sand the well is completed in and producing from. -
Test oil bopd
Well test oil rate. -
Test water bwpd
Well test water rate. -
Test Wtr_Cut (%)
Well test water cut. -
Test QLiq blpd
Well test produced fluid rate. -
Test QFgas Mscfd
Well test formation gas. -
Test FGOR scf/b
Well test Formation Gas Oil Ratio. -
Test TGLR scf/b
Well test Total Gas Liquid Ratio. -
Test GL_Rate Mscfd
Well test lift gas rate. -
Test Pio psia
Surface operating lift gas injection pressure measured during the well test (operating casing pressure). -
Calc Pio psia
Calculated surface operating lift gas injection pressure required to inject the well test lift gas rate through the orifice.- Requires lift point depth, orifice size, lift gas rate, wellbore description, produced fluid rate, PVT properties, and tubing hydraulics correlation.
- Calculates the pressure in the tubing at the lift point depth. This downstream pressure is used to calculate the required upstream pressure to inject the well test lift gas rate.
- Converts the calculated upstream pressure at lift point depth to surface pressure based on lift gas weight.
- Uses the Rigorous Injection Casing Gradient.
- Thornhill-Craver orifice valve gas passage method can be specified in the Batch GLTS input panel.
-
OR_Vlv Perf Model
Specified gas passage method in the wells database dataset. Choices are Valve Performance Clearinghouse, Thornhill-Craver, and Winkler. -
Hydrlc 3phase Model
Hydraulic model specified in the database dataset. -
Lift Point at_Orif?
Compares production tubing pressure (Ppd) with the well test surface operating lift gas injection pressure (Test Pio) at the orifice valve depth. Outputs yes or no depending on whether Ppd is less than Test Pio. -
Orifice Condition
Compares production tubing pressure (Ppd) and Test Pio at the orifice valve depth.- Output is Stable if lift gas injection pressure is 50 psi greater than flowing tubing pressure.
- Output is Un-stable if the difference is less than 50 psi.
- Output is Backcheck if the difference is zero or negative.
- The GLTS input panel allows the user to specify the delta P across the orifice to consider it stable. Default is 50 psi.
-
LBVPio Calc psia
Calculated surface opening pressure (Pio) of the Lowest Bellows Valve (LBV).- Calculates flowing tubing pressure at LBV depth based on the database dataset and hydraulics correlation.
- Calculates LBV dome pressure at depth (Pvcd) from Test Rack Opening (TRO) pressure and wellbore temperature.
- Calculates LBV opening pressure at depth (Piod) using the Force Balance Equation with flowing tubing pressure at depth and Pvcd.
- Translates LBV Piod to surface Pio based on lift gas weight.
-
Last_BV Condition
Compares LBV Pio to test Pio. LBV is closed if Test Pio is less than LBV surface opening pressure. Outputs closed or open. -
Deepest Mandrel ft TVD
Depth of the deepest mandrel in the wellbore. -
Calc_Max InjDepth ft TVD
Maximum lift point depth for available casing pressure, reported in ft TVD.- Calculates casing gradient based on user-defined gas lift design Kick Off Pressure (default from dataset).
- Drops casing pressure by a user-specified amount in the Batch GLTS panel (default 150 psi) to account for closing unloading valves (example: 5 valves x 30 psi each).
- Adjusts casing gradient for the pressure drop.
- Calculates the tubing gradient for injecting the well test lift gas rate at the bottom GL mandrel depth.
- Reports the intersection of the tubing gradient and the adjusted casing gradient.
- Constrained by tubing tail depth, not by the bottom GL mandrel depth.
-
Design Inj Depth ft TVD
Lift point depth from the database dataset, normally the orifice valve depth. -
CanLift DeeperBy ft TVD
- Compares the deepest mandrel depth with Calc_Max InjDepth and uses the lesser value.
- Outputs the difference between that lesser value and the current lift point depth (Design Inj Depth) from the database dataset.
- Constrained by the user-specified threshold in the GLTS input panel: “Flag only wells where the lift point can be moved deeper by ____ TVD ft.” Default is 500 ft.
-
Test QLiq
Well test produced fluid rate. -
QLiq Calc blpd
Calculates FBHP using well test data, the database dataset, hydraulics correlation, and wellbore description, then uses the IPR curve to determine Qliq at that FBHP. -
QLiq Diff Prcnt
Percent variance between measured QLiq and calculated QLiq. -
Test FBHP psia
Flowing bottomhole pressure calculated from well test data and the database dataset. -
calc FBHP psia
Flowing bottomhole pressure based on the calculated produced fluid rate (Qliq Calc). -
FBHP Diff (%)
Percent variance between Test FBHP and calc FBHP. -
IGOR scf/stb
Incremental Gas Oil Ratio determined by varying lift gas and tracking total gas vs total produced fluids using the well test, database dataset, and IPR curve.- Plots the well test point.
- Adds 100 Mscfd lift gas and calculates a new FBHP.
- Determines new produced fluid rate from the IPR.
- Calculates new total gas rate using the well’s TGLR.
- Plots the new point on Total Gas vs Total Produced Fluids.
- Accounts for water cut.
- Reports change in Total Gas per unit change in oil production.
- Units are scf per stb.
- This is the IGOR of the well.
-
GasVlcty aboveInj ft/sec
Gas velocity in the tubing 100 ft TVD above the lift gas injection point. -
GasVlcty belowInj ft/sec
Gas velocity in the tubing 100 ft TVD below the lift gas injection point. -
GLVlcty MinLift ft/sec
Minimum lift gas velocity needed to keep liquid droplets moving up the wellbore. -
P_Res well model
Reservoir pressure from the database dataset. -
PI_BH bpd/psi
Well productivity index calculated from well test rate, reservoir pressure, and well test FBHP. -
OilRate Benefit bopd
Moves the lift point to the CanLiftDeeperBy depth, calculates FBHP, and determines the oil rate from the well’s IPR and database dataset for that FBHP. -
Tst_Sep press psi
Test separator pressure measured during the well test. -
FTP - Tst_Sep press psi
Flowing tubing pressure minus test separator pressure. Wells tested with excessive backpressure or operating with a restricted production choke will often show values greater than about 20 psi. -
Well Name
Repeats the well name in the Technical Data Base. Specifies the main wellbore and does not identify laterals.
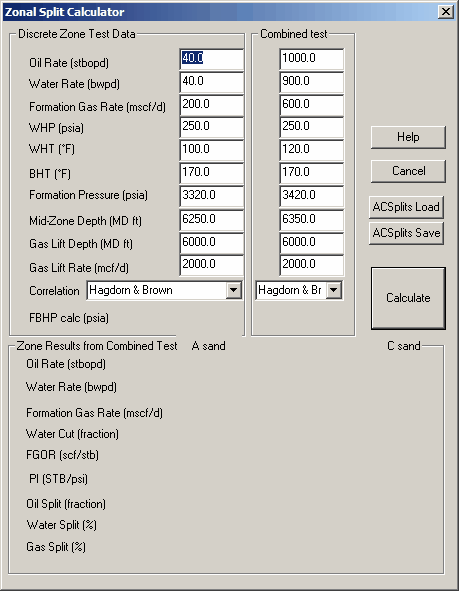
5. Perform Zonal Splits Calculations
Perform quick zonal splits calculations based on the configured well and interval inputs.
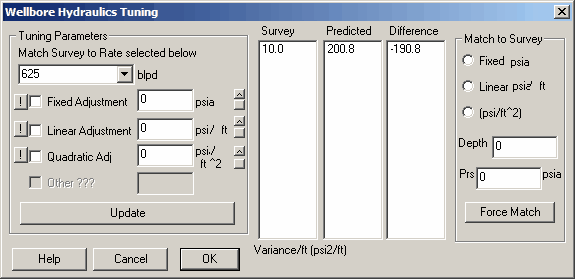
6. Perform Hydraulics Tuning for Pressure Gradients
Perform quick hydraulics tuning calculations.
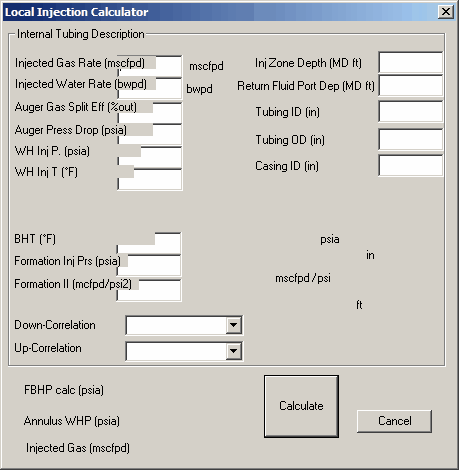
7. Perform Local Injection Calculator
FYI
This technique is no longer implemented and is therefore obsolete.
8. Reset Graphs Style
Select this option to reset all graph templates. This is similar to re-installing all teh .oc2 and .oc3 files.