Graphs Menu
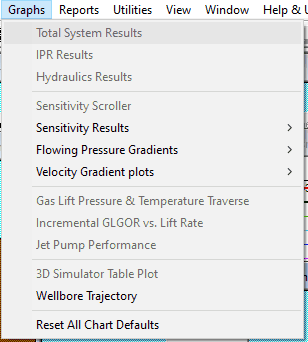
You can edit any graph’s properties by right-clicking on the plot. Changes are temporary unless you save the new format. Press Ctrl+S after editing to save a graph format.
| Option | Description |
|---|---|
| Total System Results | Show classic nodal plot of rate vs. pressure. |
| IPR | Show IPR plot only. |
| Hydraulics | Show hydraulics curves only. |
| Sensitivity Scroller | Open the Sensitivity Scroller to adjust parameters graphically and see the immediate effect on the total system graph. |
| Sensitivity Results | Show four plot choices of rate/pressure versus a sensitivity parameter for IPR and Hydraulics when available. |
| Tubing Pressure Gradients | Provide tubing pressure profiles (VLP) for each rate and sensitivity, and for the solution rate. |
| Velocity Gradient Plots | Provide velocity profiles for each rate and sensitivity along the wellbore. Minimum lift velocity is also shown along the wellbore. |
| Gas Lift Design Plot | Available for detailed gas-lift cases and updates automatically when the case is run. |
| Incremental GOR vs. Lift Rate | Show the incremental GOR versus lift-rate plot. |
| Jet Pump Performance | Available for jet-pump cases and updates automatically when the case is run. |
| 3D Simulator Tables | Show a 3D plot of a bottomhole pressure surface for the generated rates, WHP, and gas-lift rates. |
| Wellbore Trajectory | Show a side view of the wellbore accounting for inclination changes, not azimuth. Useful for checking if horizontal sections are toe-up or toe-down. |
| Reset All Chart Defaults | Reset all .oc2 files to original settings. Faster than reinstalling and can repair broken graph layouts. |
1. Total System Plot
The main rate-versus-pressure plot appears when you select this option. You can highlight any line by clicking its legend item. Press and hold the mouse button to keep it highlighted.
All graph properties can be edited by right-clicking anywhere on the plot. Changes are temporary unless you save the format. After editing, press Ctrl+S to save the current graph format.
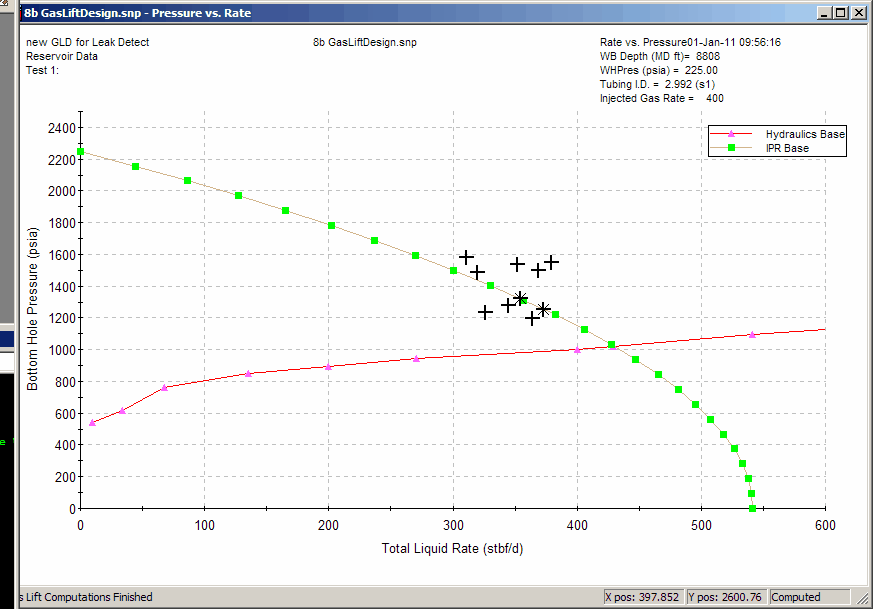
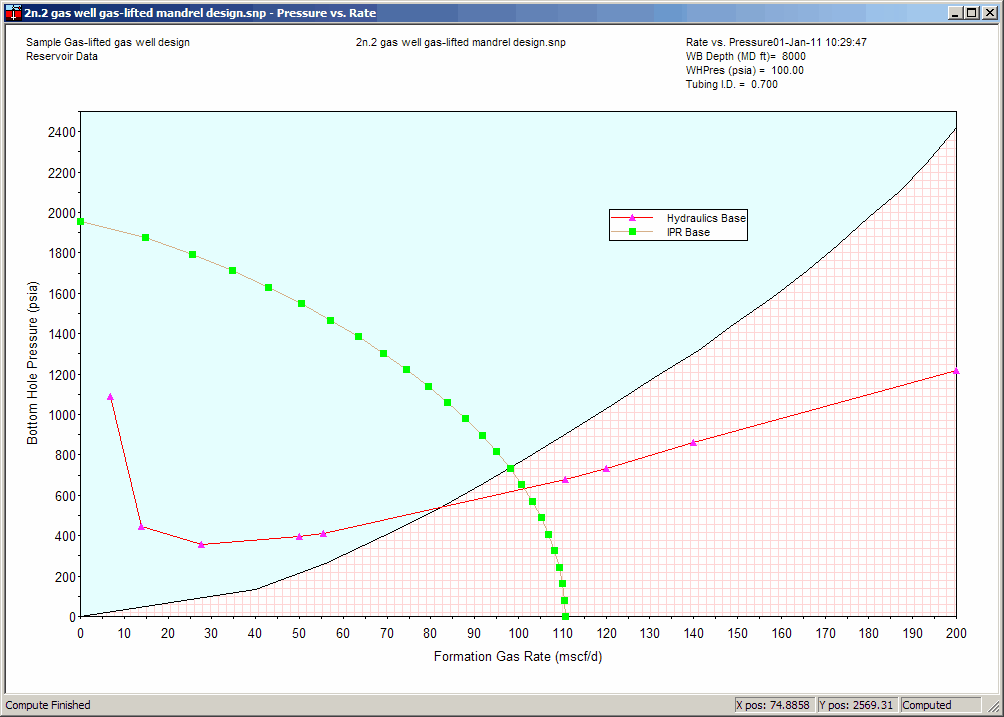
If Show loading rates is enabled in the toolbar or in Global Preferences, the plot will indicate rates below loading in blue (referenced to the top wellbore segment) and areas with rates above unloading using a crosshatch pattern. This overlay is available for gas and oil wells, but is most relevant for gas wells.
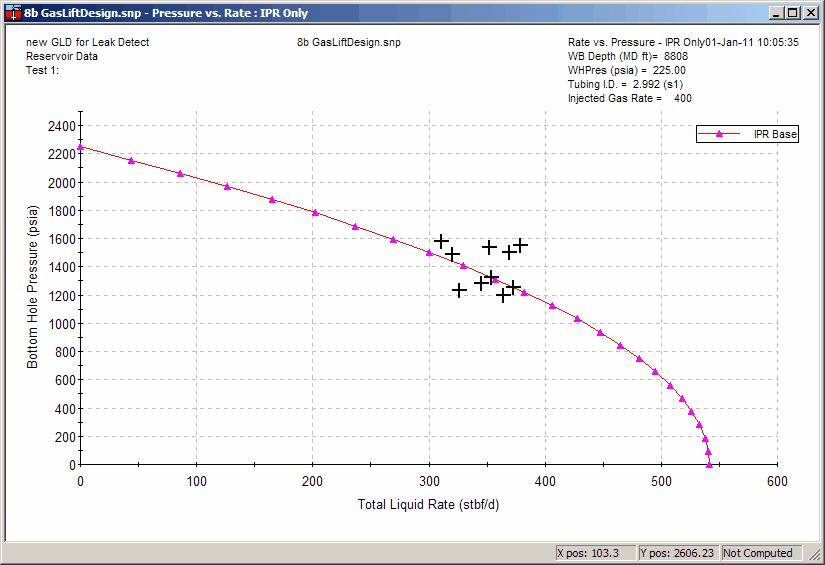
2. IPR Plot
Only the IPR data is shown when this graph option is selected. This view is useful when you want to focus on tuning IPR parameters without displaying Hydraulics. It will also appear if you press Apply while on any IPR panel.
Shortcuts:
- Toolbar:

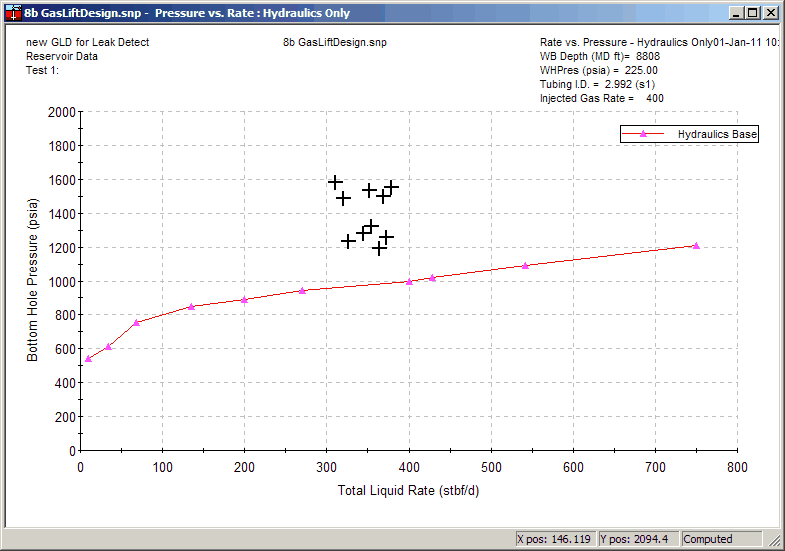
3. Hydraulics Plot
Only the hydraulics data is shown when this option is selected. Use it to tune hydraulics parameters without displaying IPR. This view also appears when you press Apply on any Hydraulics panel.
Shortcuts:
- Toolbar:

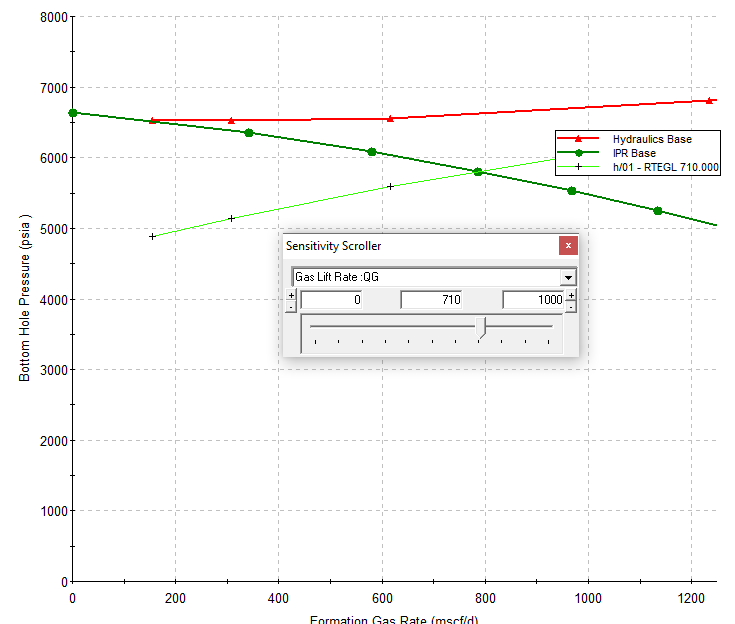
4. Sensitivity Scroller
Use the Sensitivity Scroller to quickly tune parameters and find match values without typing numbers on the sensitivity panels.
Tip
Turn off any other active sensitivities (set them to None) before using the scroller to avoid conflicting changes.
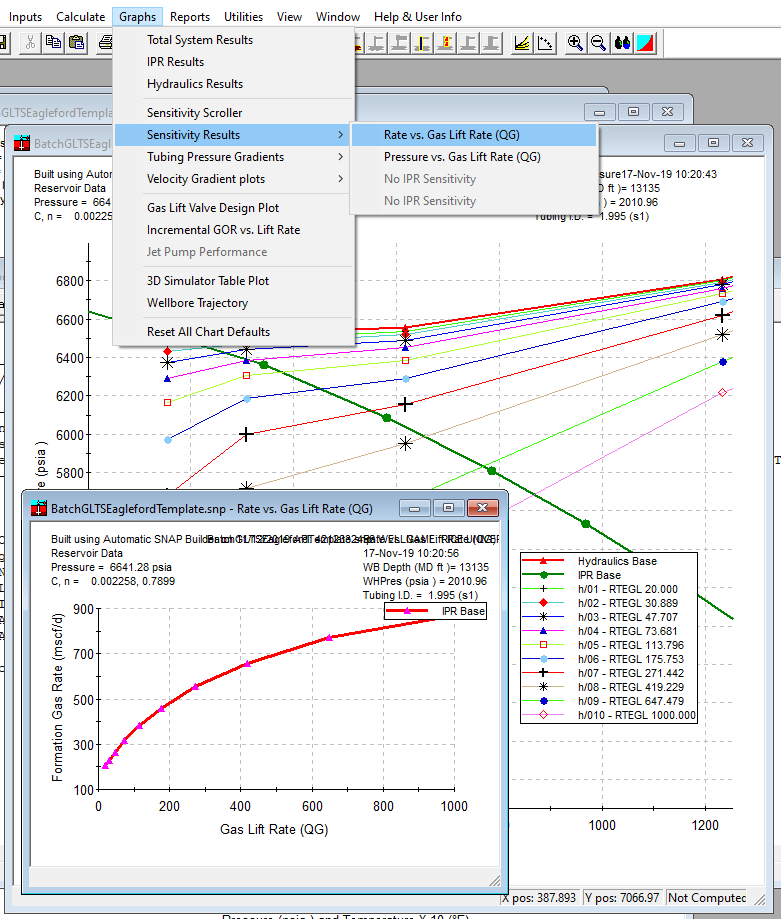
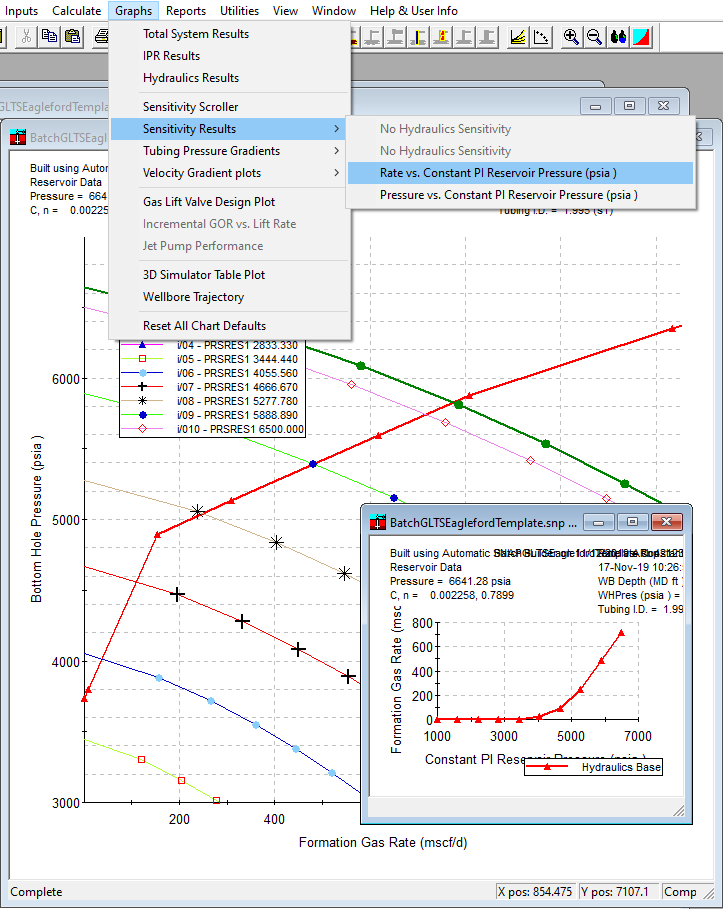
5. Hydraulics Sensitivities Plots
Sensitivity plots compare a selected hydraulics parameter against rates or pressures. Activate them from Graphs > Sensitivity Results.
Menu availability
The Sensitivity Results option is disabled until a run is made and will not appear if no sensitivities are defined.
Sample hydraulics sensitivity plots
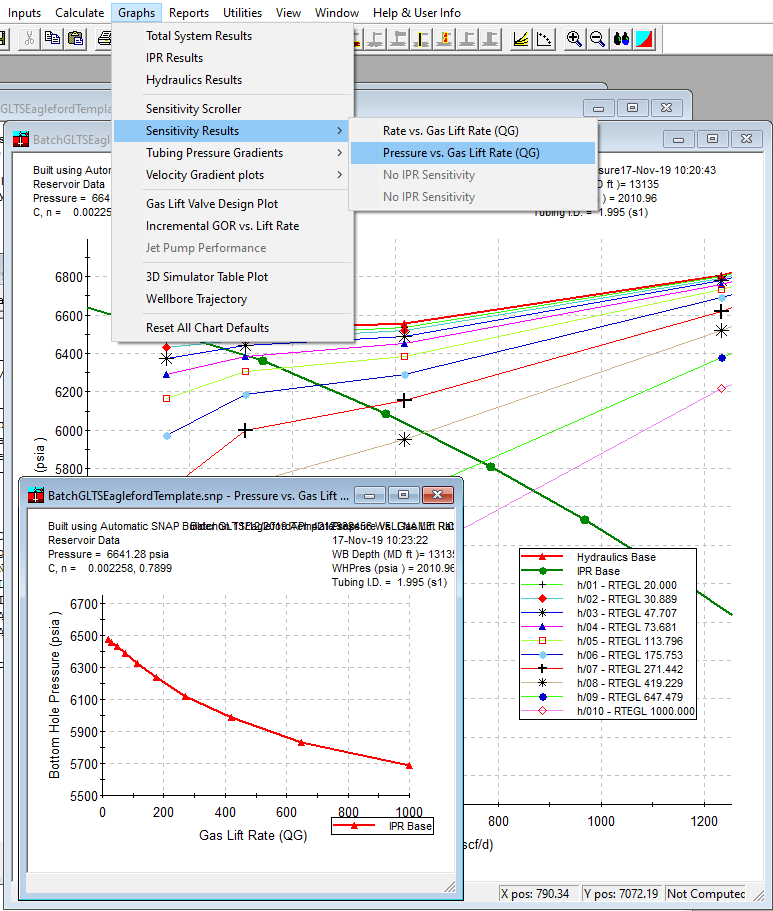
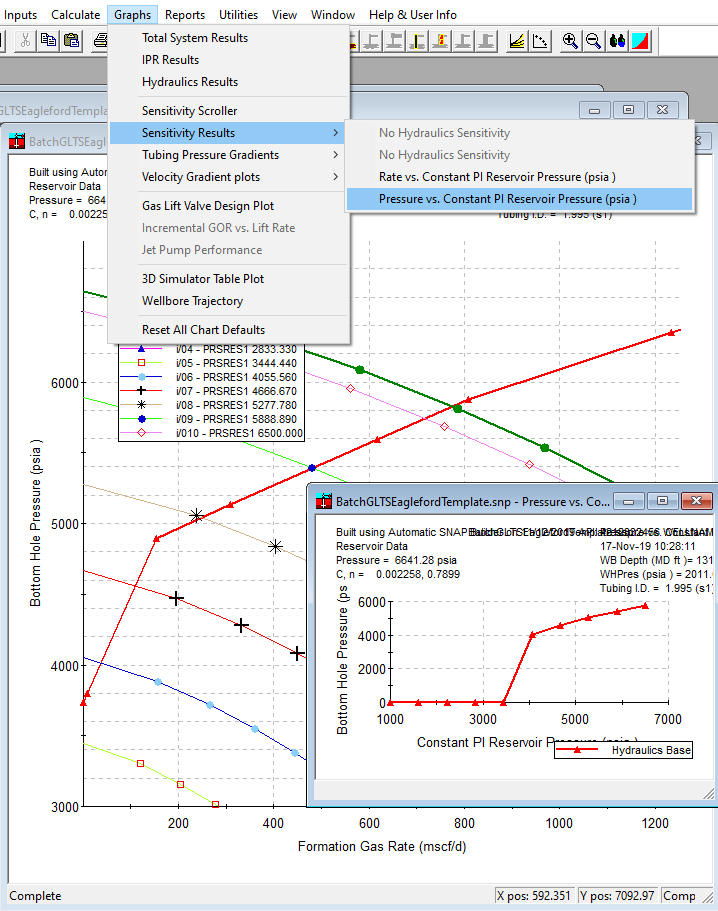
6. IPR Sensitivities Plots
Sensitivity plots compare a selected IPR parameter against rates or pressures. Activate them from Graphs > Sensitivity Results.
Menu availability
The Sensitivity Results option is disabled until a run is made and will not appear if no sensitivities are defined.
Sample IPR sensitivity plots
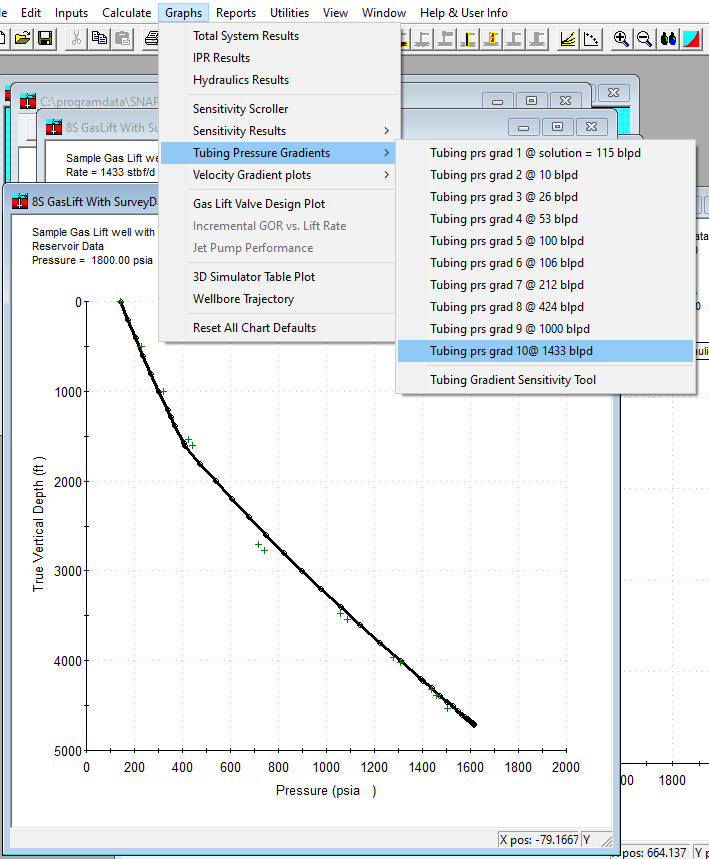
7. Tubing Pressure Gradients
Pressure gradients versus depth are available from Graphs > Tubing Pressure Gradients.
When this menu is available
This menu is disabled until a run is made.
How to read the menu:
- The top menu item is usually the solution rate.
- The items below it correspond to each rate included in the hydraulics run.
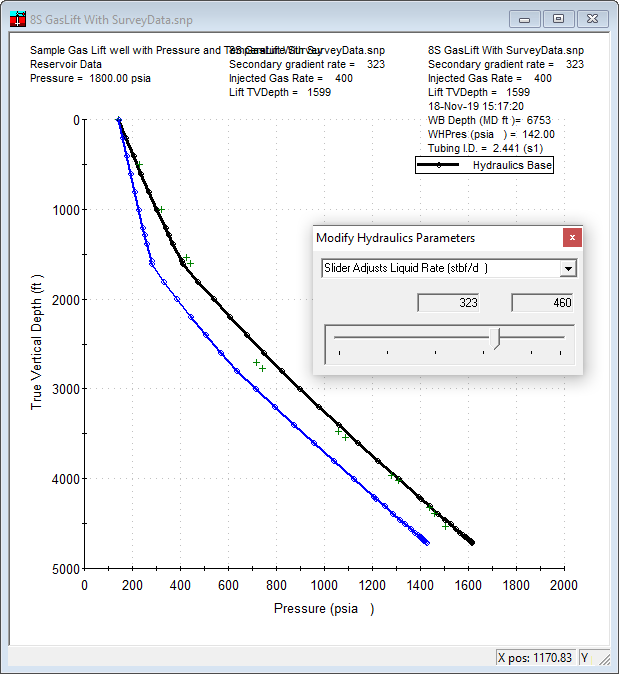
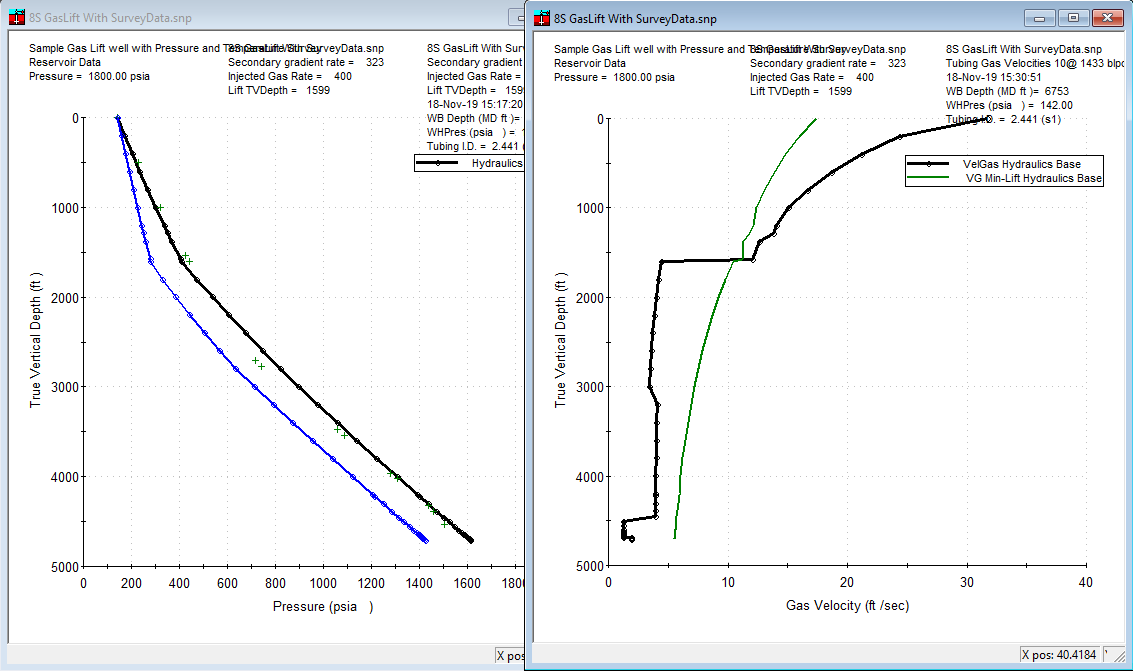
Plotting pressure survey data
If pressure survey data is entered, it will appear on these plots. The survey was taken at one rate, while these plots may show several rates. It is acceptable to overlay the survey on a VLP for a different rate, but note the difference clearly so readers do not confuse the two.
7.1. Tubing Gradient Sensitivity Tool
First open a gradient plot you want to review, then select the Tubing Gradient Sensitivity Tool.
- The tool places a second rate curve on the active plot.
- It lets you quickly preview how other rates would look on the same depth profile.
- Similar multi-rate tools are available on the Gas Lift panels.
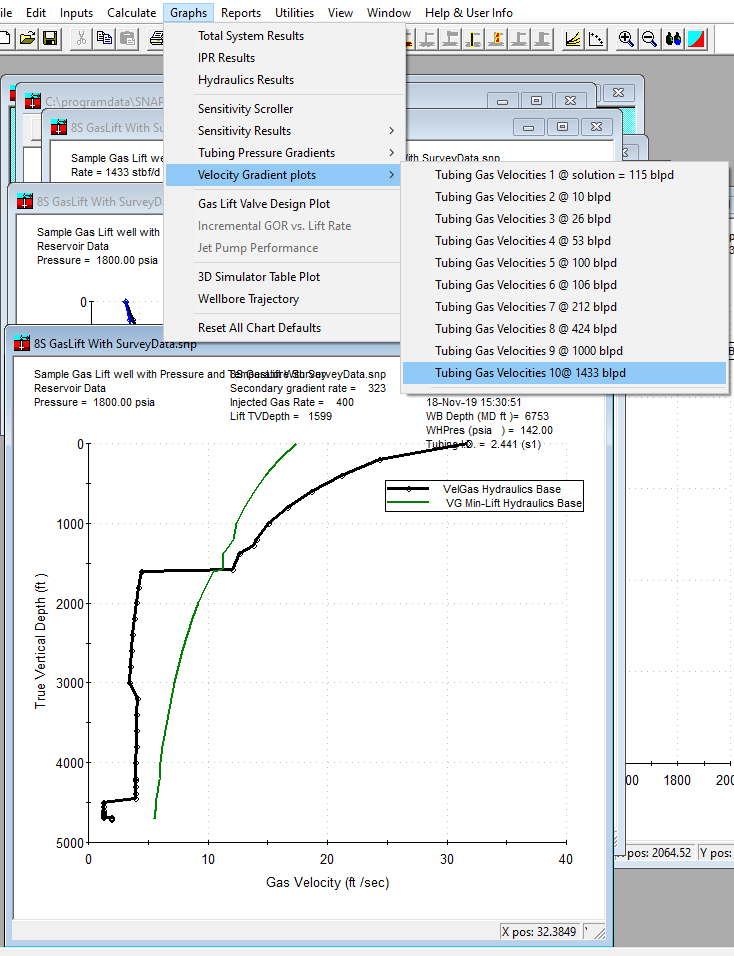
8. Velocity Gradient Plots
Velocity Gradient plots show the speed of gas in the flowpath compared to the minimum lift velocity under similar pressure and temperature conditions. Access these from Graphs > Velocity Gradient Plots.
When this menu is available
This menu item is disabled until a run is made.
Interpretation tip:
- Use these plots to identify sections that are loading up where the actual gas velocity falls below the minimum lift velocity.
- In the example below, a complex wellbore is loading up below 1500 ft where gas injection occurs.
8.1. Complement of Tubing Pressure Gradients
Velocity Gradient plots complement the Tubing Pressure Gradient plots by showing whether the observed pressure profile is accompanied by inadequate lift velocities.
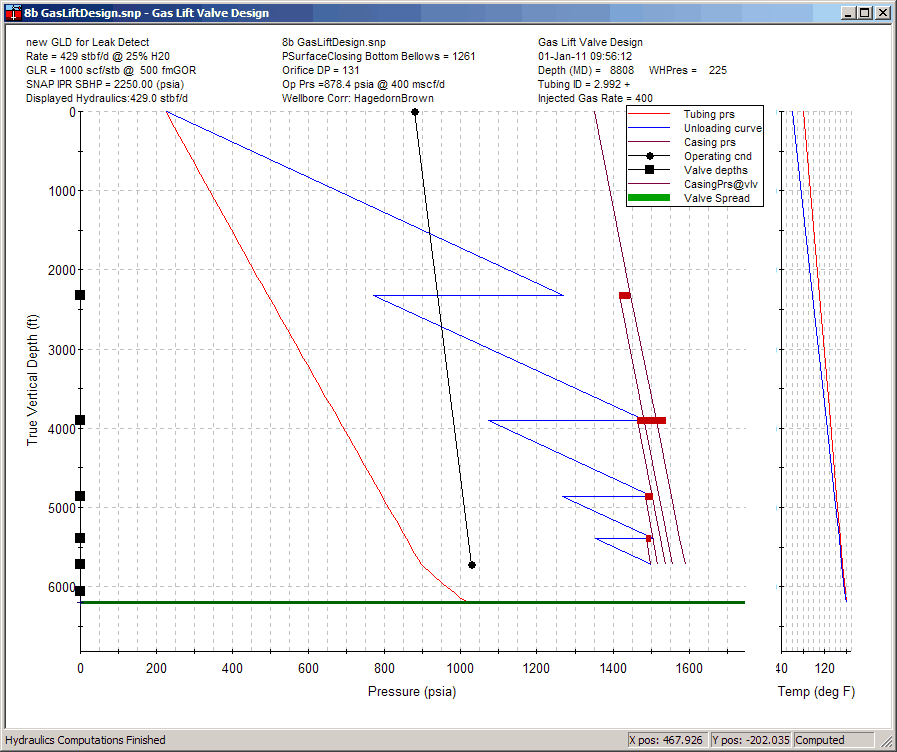
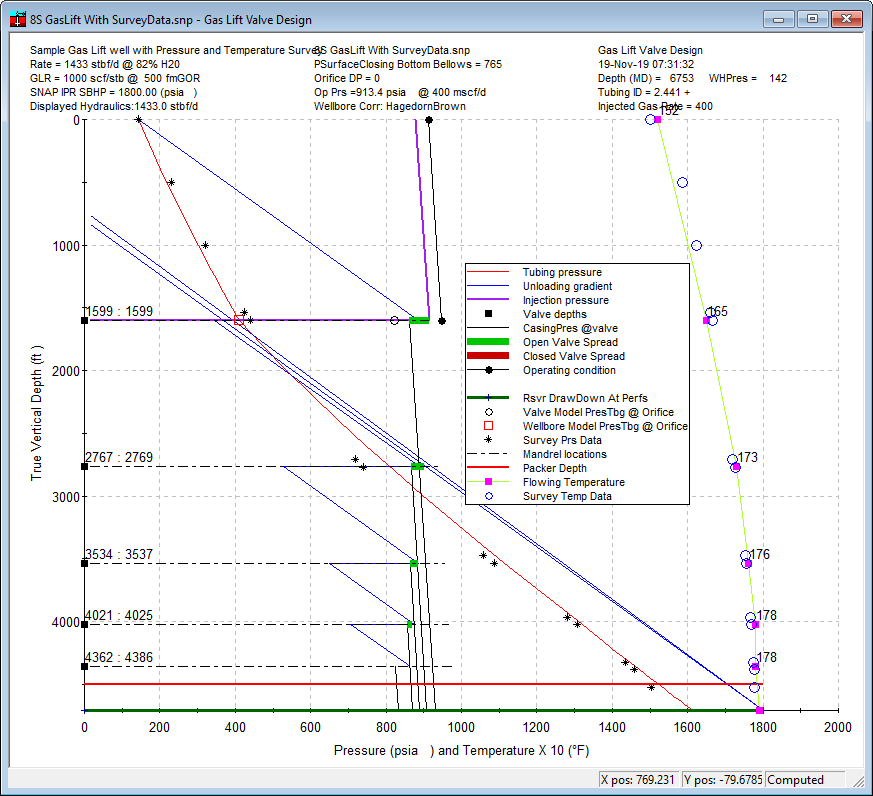
9. Gas Lift Design Plot
The Gas Lift Design plot is shown when this graph option is selected. It also appears when you press Apply in the Gas Lift Design dialog or when you use Calculate All.
Where to find it
Graphs > Gas Lift Valve Design Plot
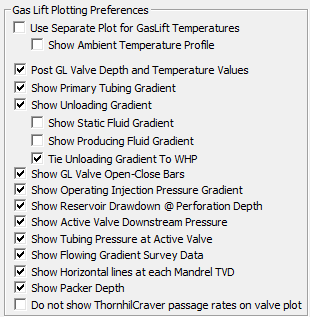
9.1. Customization
You can customize what is displayed using Edit > Preferences. A sample of the available choices is shown below.
9.2. Complex cases
Below is an example of a more complex gas lift plot.
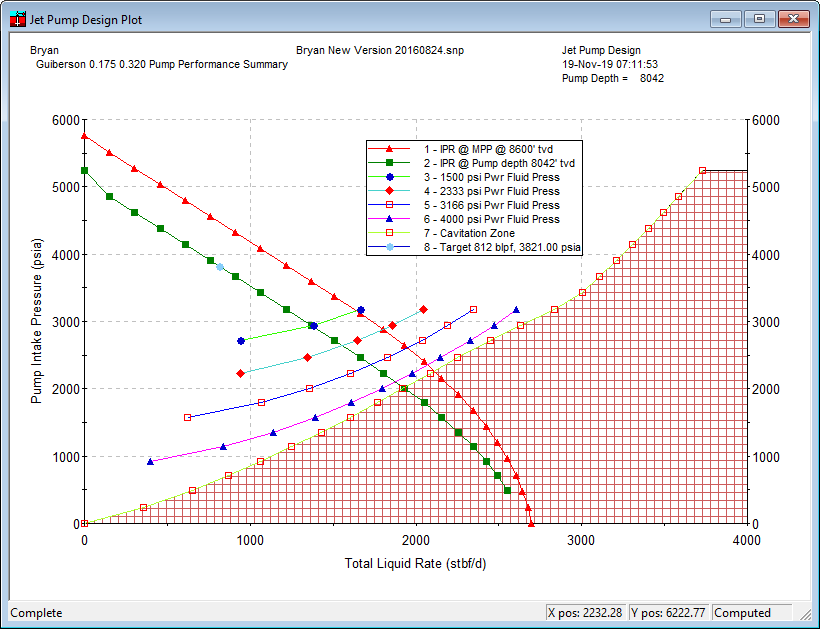
10. Jet Pump Design Plot
The Jet Pump Design plot is shown when this graph option is selected. It also appears when you press Apply in the Jet Pump dialog or when you use Calculate All.
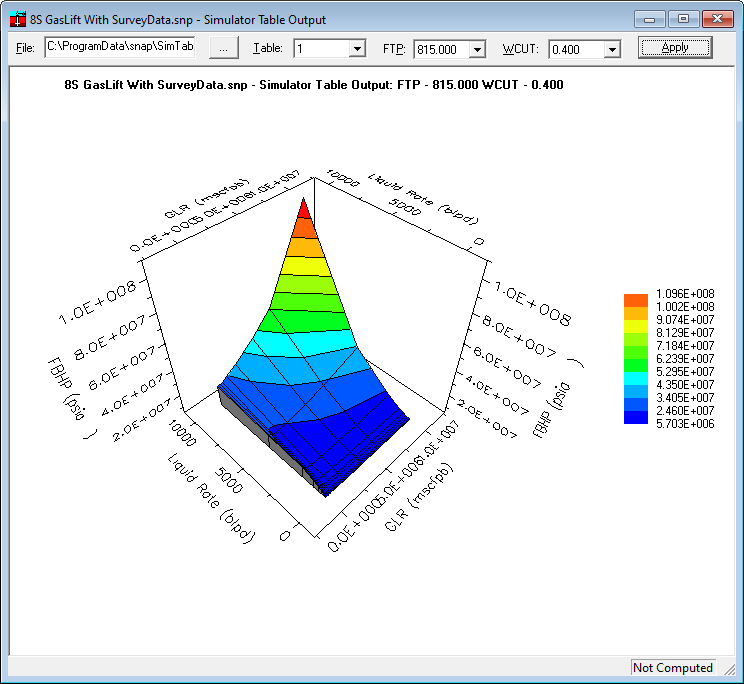
11. Graph 3D Simulation Results
This rarely used view shows a 3D surface generated from the simulator tables (for example, bottomhole pressure vs. rate, WHP, and lift-gas rate).
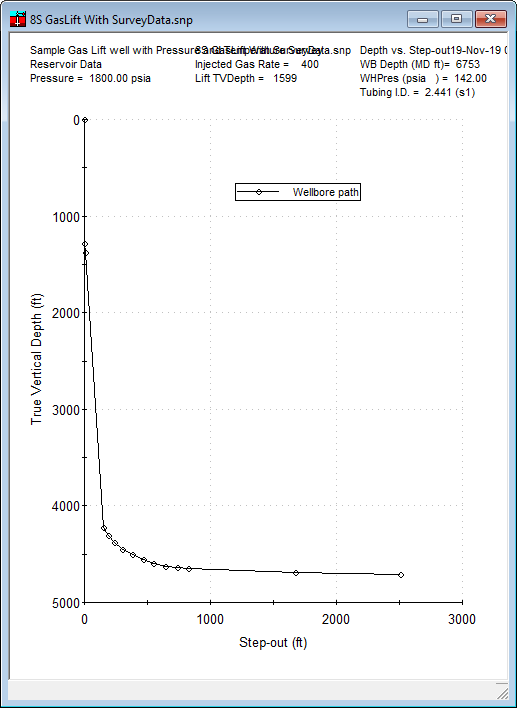
12. Wellbore Trajectory
The Wellbore Trajectory plot shows a side view of the wellbore, ignoring azimuth changes. It is helpful for checking whether horizontal sections are toe up or toe down.
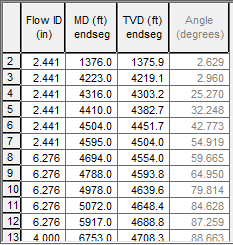
If deviation survey data is available, it is plotted alongside the wellbore segments. To use a deviation survey, enter measured depth values and the true vertical depth values will update automatically to match the survey.
Input example
Simple trajectory plot produced
Unsynchronized entries example
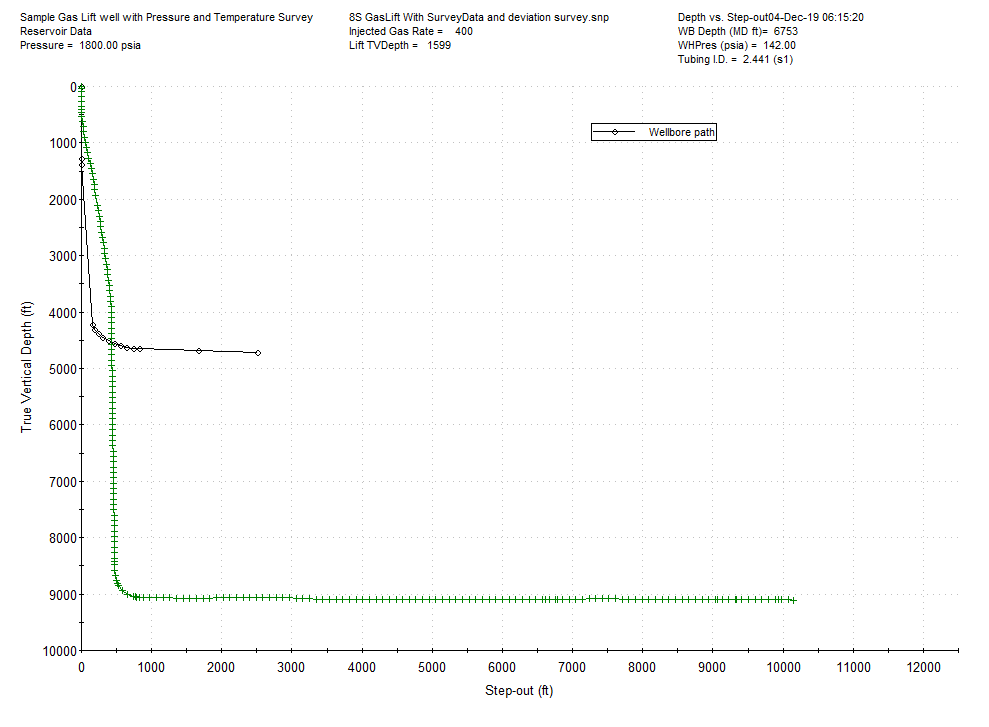
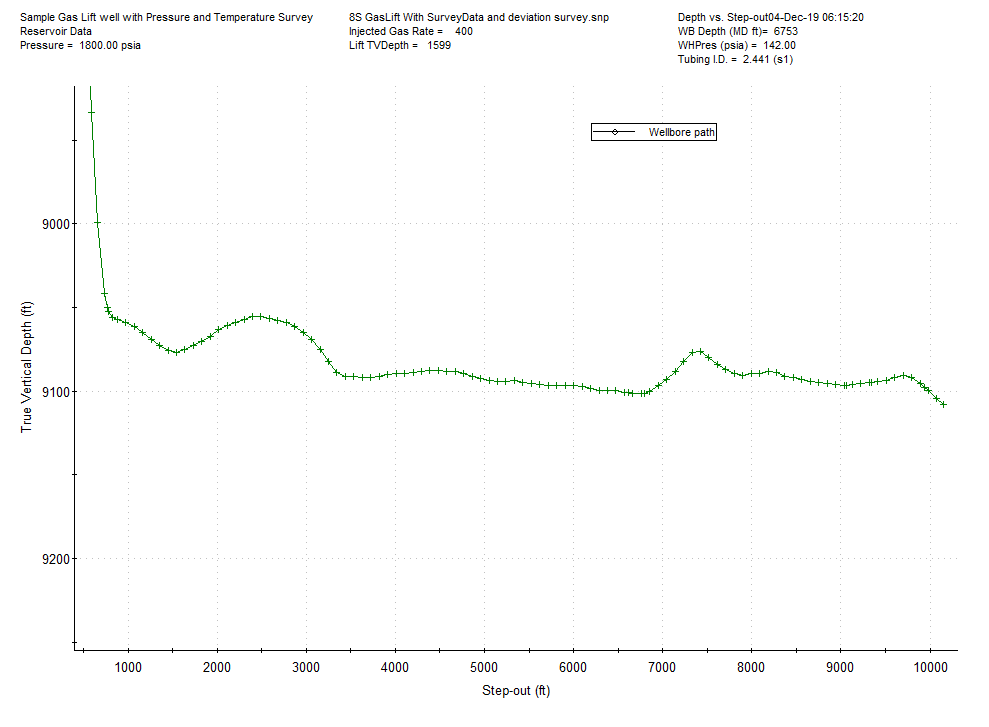
Zoomed horizontal section
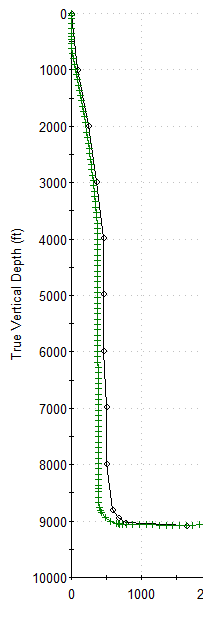
Synchronized entries example
13. Reset All Chart Defaults
Select this option if you have modified plot layouts and the results look wrong or you cannot find plots when they should be visible.
Where to find it
Graphs > Reset All Chart Defaults
What it does
Restores all saved chart layout files to their original defaults.
Why use it
Faster than reinstalling and often fixes layouts that appear broken or misaligned.