PVT Properties
1. PVT Properties
1.1. Overview
1.2. Basic Fluid Properties
-
Reservoir Temperature (F):
Bottomhole temperature at reservoir depth. Obtain from direct measurement or estimate using the local geothermal gradient and the surface temperature:where is the reservoir temperature (F), is the surface temperature (F), is the geothermal gradient (F/ft), and is the true vertical depth at mid-perforation (ft).
-
Gas Specific Gravity:
Ratio of produced gas molecular weight to air molecular weight. Obtain from PVT analysis. The specific gravity of pure methane (100 percent) is about 0.565; 0.7 is typical for associated gas. -
Oil Gravity:
Defined by:where is the oil specific gravity relative to fresh water at standard conditions (62.4 lb/ft).
-
Water Gravity
Ratio of produced water density to fresh water density at standard conditions.
1.3. Surface and Separator Conditions
-
Separator Pressure (psia): Pressure at which the physical properties of the produced fluids were measured.
-
Separator Temperature (F): Temperature at which the physical properties of the produced fluids were measured.
1.4. Phase Ratios and Cut
- Gas Oil Ratio (scf/stb):
For an oil well, ratio of produced gas (scf) to produced oil (stb). For a gas-condensate well, the liquid yield is the produced condensate (stb) per mmscf of gas. A liquid yield of 1.0 equals a GOR of 1,000,000:
- Water Cut:
Decimal fraction of produced water in the total liquid stream:
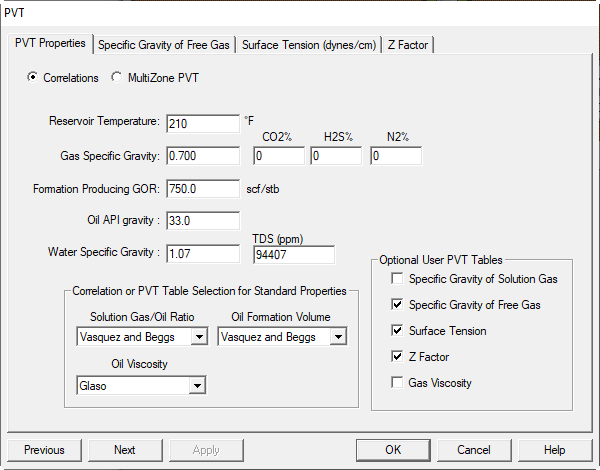
1.5. PVT Input Options
PVT data is handled separately for IPR and Hydraulics calculations. For IPR, you can use correlations or input values.
1.5.1. Solution Gas/Oil Ratio correlations
-
Lasater’s Correlation: Considered more accurate than Standing’s for higher gravity crudes (API greater than 15). (Trans. AIME, 1958, p. 379)
-
Standing’s Correlation: Based on 22 California crudes; good accuracy for crude gravities less than 15 API. (API Drilling and Production Practices, 1947, p. 275)
-
Vasquez and Beggs Correlation: Developed from a larger data set for generalized use. (J. Pet. Tech., June 1980, p. 968). Often a good default when uncertain.
-
Glaso Correlation: Developed for North Sea crudes and generalized for broader use; shows improvement over Standing’s correlation. (J. Pet. Tech., May 1980, p. 785)
1.5.2. Oil Formation Volume Factor correlations
-
Standing’s Correlation: Based on 22 California crudes; good for crude gravities less than 15 API. (API Drilling and Production Practices, 1947, p. 275)
-
Vasquez and Beggs Correlation: Larger database to generalize behavior. (J. Pet. Tech., June 1980, p. 968). Often a good default.
-
Glaso Correlation: North Sea based; generalized with improved results over Standing’s. (J. Pet. Tech., May 1980, p. 785)
1.5.3. Oil Viscosity options
The dead-oil (or total liquid) viscosity is required as a baseline for in-situ properties. Choose one:
- Beggs and Robinson Correlation: (general purpose)
- Glaso Correlation: (use when the Glaso solution GOR method is selected)
- Total Liquid Viscosity Table: (2-D table that overrides correlations and supplies a net liquid viscosity independent of water cut; useful to hard-wire a specific viscosity for testing). Enter at least four values so the grid spans the expected pressure and temperature range. Recommended bounds: Pressure 0 to 22,500 psia; Temperature 0 to reservoir temperature (F).
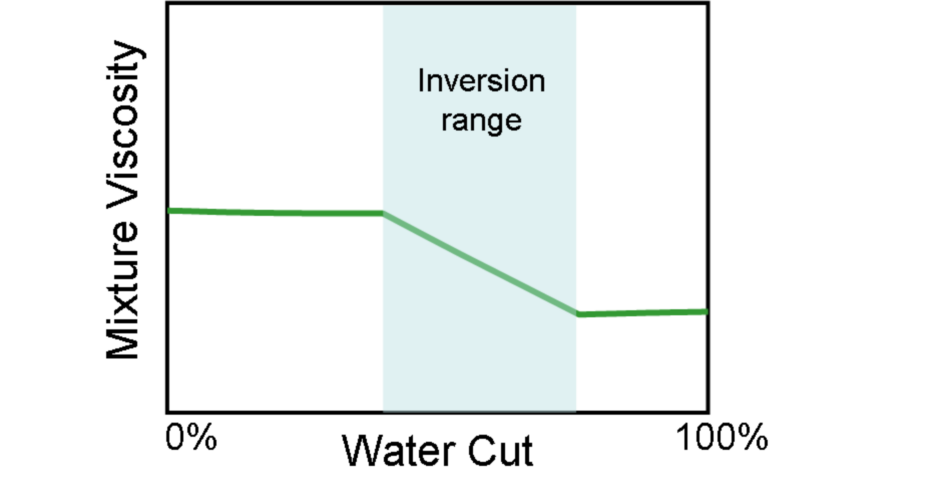
1.5.4. Additional viscosity notes and inversion model
For oil and water mixtures, an inversion model is used to calculate the net viscosity within the IPR relationships. Hydraulics mixing rules follow each correlation’s suggested averaging technique.
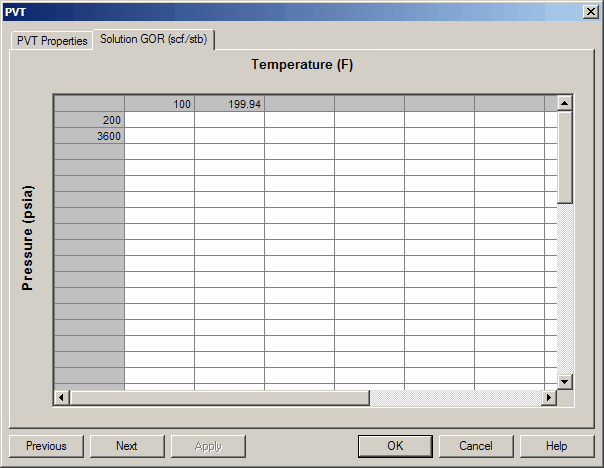
2. User Defined PVT Properties
The following items can be edited on the PVT Properties grid panels:
- Pressure ranges
- Temperature ranges
- Property values at each temperature and pressure: The sample below shows Solution GOR. Values should cover the entire range from reservoir to delivery conditions.
To access further detailed panels, make selections in the lower-right corner of the main PVT dialog.