Pressure Survey, Rate/Pressure Match and Relative Permeability
1. Solution Point Match, Pressure Gradient Survey, Database Welltest Data, and Relative Permeability Data
Shortcut Toolbar:
![]()
This group of panels collects real field data you want to see on the nodal and gradient plots. Most entries are for documentation and validation and are not used directly in calculations. If you arrive here with nothing to enter, select OK to return to the ready position.
FBHP is required for a valid match
For Match Data, you must know the flowing bottomhole pressure (FBHP) at each rate you enter. The program can estimate FBHP from current hydraulics, but that estimate is not unique and will simply fall on the calculated hydraulics profile.
1.1 Match Data
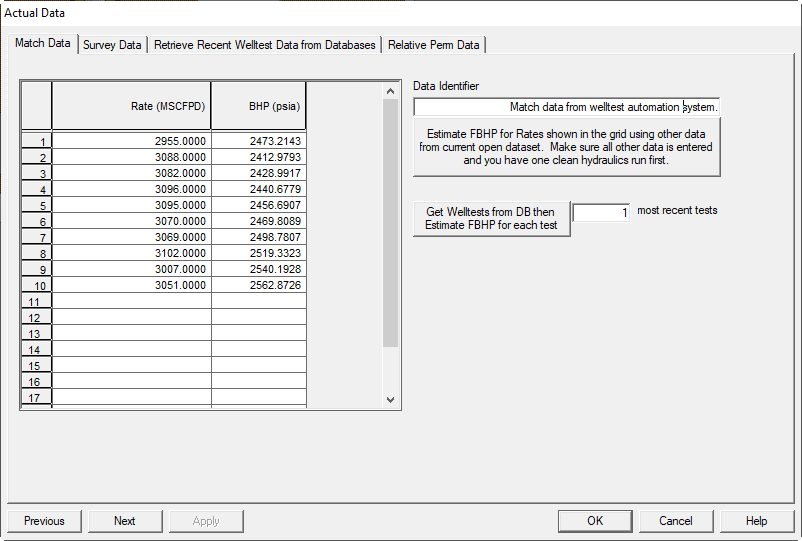
The following items can be entered and will be plotted on the nodal plot.
- Rate: Units depend on the well type. In the pictured example, the well is a gas well.
- BH Pressure: Measured or estimated pressure at the end of the defined wellbore. If you need pressure at a specific depth, use the Survey Data panel.
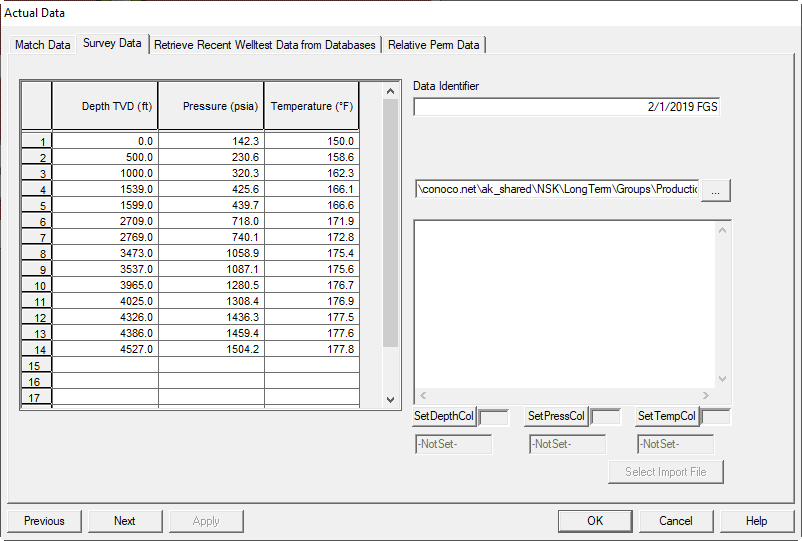
1.2 Survey Data
This tab holds point measurements for the gradient plots, typically collected with a slickline tool at specified depths.
- Depth TVD (ft): True vertical depth of the survey point.
- Pressure at this TVD depth: Measured pressure at that depth.
- Temperature at this TVD depth: Measured temperature at that depth.
- Data Identifier: Note the well flow rate or other context at the time the survey was obtained.
1.3 Retrieve Recent Welltest Data from Databases
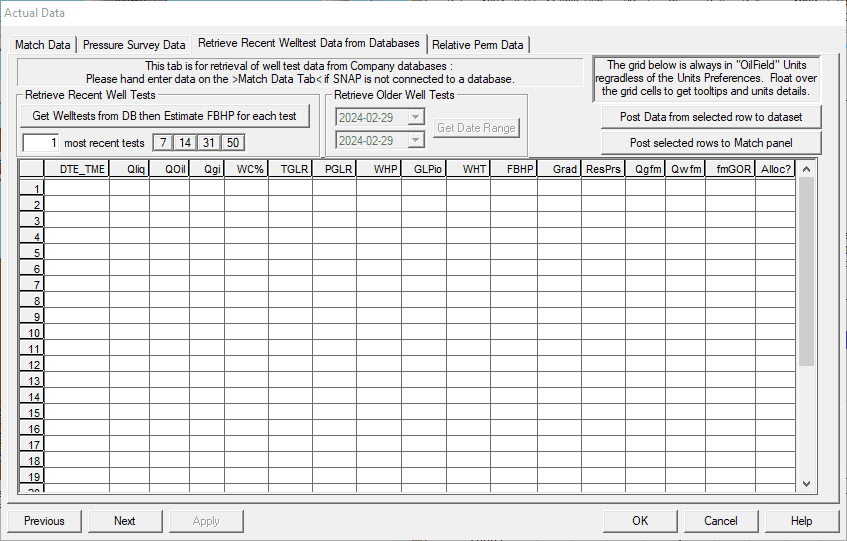
This tab fetches recent well tests from connected databases per your user preferences.
1.4 Relative Permeability Data
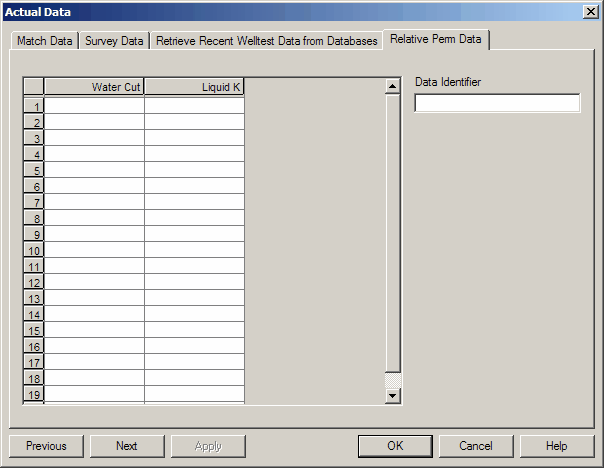
This panel is rarely needed. It can curb an IPR curve when a water cut change alters mobility and would otherwise force an unrealistic productivity increase.
- Water Cut: Water fraction at which the relative permeability applies.
- Liquid K: Effective liquid mobility term used to temper the IPR response.
2. Survey Data Example
This panel provides a utility to import survey data. Contact the program contacts if you are interested in using this feature.
Tip: save plot formatting
Keyboard hotlink Ctrl-S saves most formatting changes made to plots so they persist.
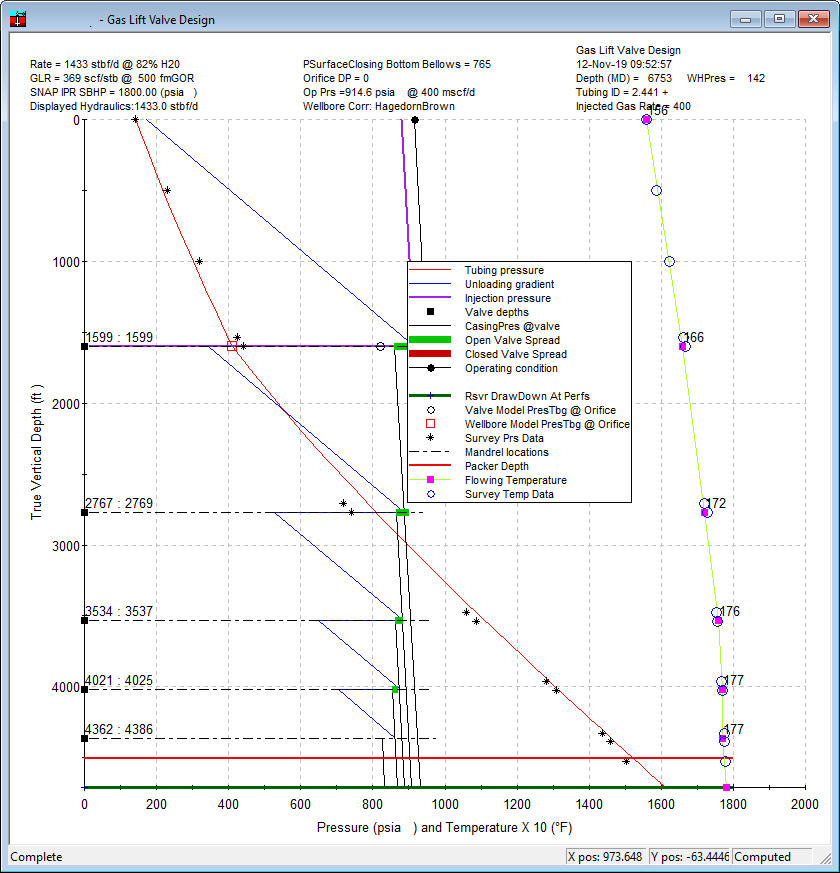
2.1. Survey Data Example Results Plot
The black stars are the pressure data, and the open blue circles are the temperature data.
Tip: save plot formatting
Keyboard hotlink Ctrl-S saves most formatting changes made to plots so they persist.