IPR types
1. Oil IPR: Options
-
Darcy’s Law: The IPR is generated using Darcy’s Law and the basic reservoir and fluid properties. This approach is valid for flow above the bubble point or for high water cut wells. This selection allows up to 5 independent zones.
-
Vogel’s Method with Reservoir Data: The IPR is generated using Standing’s extension to Vogel’s original generalized IPR. The IPR is based on the reservoir and fluid data and combines Darcy’s Law above the bubble point with Vogel-type relationships below the bubble point. This selection allows up to 5 independent zones.
-
Vogel’s from One Rate Test: This approach uses a single rate test to generate an IPR with a constant productivity index above the bubble point and a Vogel-type relationship below the bubble point. The reservoir pressure is required.
-
Vogel’s from Two Rate Test: This approach solves Vogel’s equation for two tests simultaneously to find the reservoir pressure and maximum flow rate. This option assumes the reservoir pressure is equal to the bubble point pressure.
-
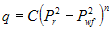
Fetkovich from Multi-Point Test: This approach fits multi-point test data to the empirical equation to determine the coefficient and the exponent . The test may be a conventional flow-after-flow test, an isochronal test, or a modified isochronal test. The minimum number of rates is 2 and the maximum is 10.
- Conventional Flow-After-Flow Test
- Isochronal Test
- Modified Isochronal Test
-
Fetkovich from C and N: The IPR is generated from the Fetkovich equation using a user-supplied coefficient and exponent, obtained from independent analysis of a multi-point test.
-
Constant Productivity Index: The IPR is generated from a user-supplied constant productivity index. This option is valid only for wells flowing above the bubble point or for high water cut wells.
-
Constant Productivity Index from Fluid Level Data: The productivity index is calculated from two flow rate tests and the corresponding fluid levels in the annulus.
Completion Pressure Drop Included in FBHP Measurement
The second through seventh options, which measure flowing bottomhole pressure when constructing the IPR curve, do not allow you to separately calculate the pressure drop across the completion since it is implicitly included in the pressure measured downstream from the completion.
-
Babu & Odeh Horizontal Well Model: This IPR model uses the method outlined by Babu and Odeh to model horizontal well performance, including the effects of position in the drainage area. Several simpler models are available, but this one supersedes the capabilities of each of those.
-
Fractured Well Model: This IPR uses either the linear flow equation for very early-time predictions or the quadratic equation with a modified for pseudo-radial flow during late times . Refer to SPE Monograph 12: Recent Advances in Hydraulic Fracturing, pages 325–331, for a detailed discussion. This is a transient model and is therefore dependent on time.
-
User Defined IPR Model: This IPR model allows entry of user-input IPR parameters in case none of the above models adequately describes the well behavior.
1.1. Darcy’s Law and Vogel with Reservoir Data
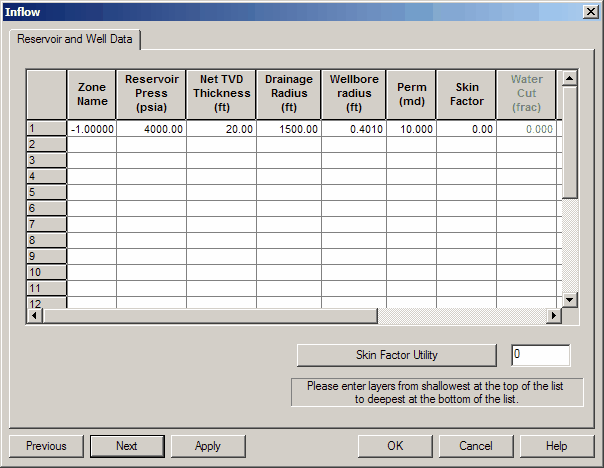
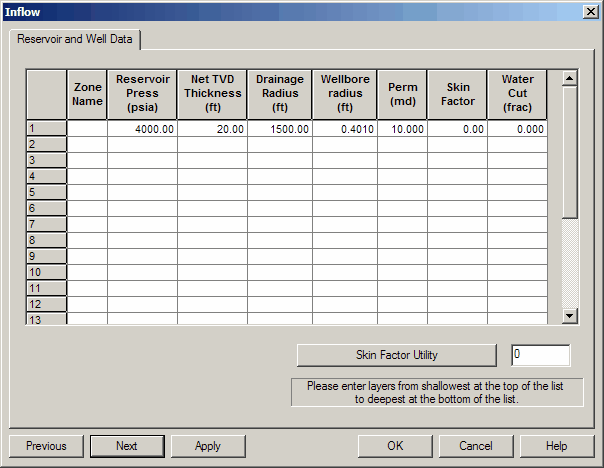
The following items may be edited on the Reservoir and Well Data panel:
- Reservoir Pressure (psia) — The mean reservoir pressure within the well’s drainage area; typically derived from pressure-buildup analysis.
- Net TVD Thickness (ft) — The thickness of the interval believed to contribute flow. Usually taken from well-log interpretation and should align with the average permeability used.
- Drainage Radius (ft) — The distance from the well to the no-flow boundary created by offset wells in a developed pattern. It equals one-half the square root of the well spacing, where is the spacing in acres.:
- Wellbore Radius (ft) — Taken from the caliper log, or from drill-bit size when hole washout is negligible. “Wellbore Radius Examples” can be used for guidance.
- Permeability (md) — Absolute (fluid-independent) permeability averaged over the net pay. Commonly measured on core samples using air. Effective (fluid-dependent) permeability can be estimated via pressure-transient analysis and then converted to absolute values.
- Skin Factor — A dimensionless indicator of near-wellbore condition: positive values indicate damage; negative values indicate stimulation. Obtained from pressure-transient analysis (drawdown or buildup). Completion effects are included (e.g., horizontal wellbore, perforation density, gravel pack).
- Water Cut (frac) — The fraction of the total liquid production that is water. Reported fluid rates are total liquid and therefore include this fraction.
- Fracture Pressure (psia) — The pressure at which the injectivity-index slope changes as the reservoir begins to fail. Typical fracture-gradient range: 0.7–1.2 psi/ft.
- Max Rate — Unlike an IPR curve, injectivity is limited only by what can be pumped into the formation. Enter the highest anticipated injection rate; the IPR calculation will generate points from 0 up to this value. Very large entries can ensure a valid intersection but may reduce IPR-curve resolution.
- Post-Frac Skin
- Choke
1.2. Vogel’s One Rate Test Data
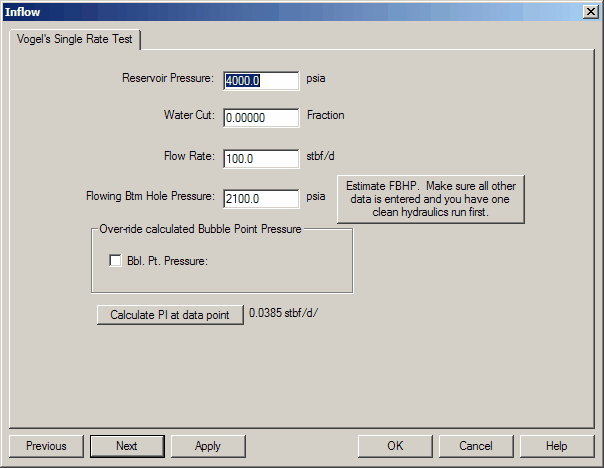
- Reservoir Pressure (psia) — Average reservoir pressure in the well’s drainage area, typically from pressure-buildup analysis. This option uses a single reservoir pressure value for all zones.
- Water Cut (fraction) — Fraction of the total liquid stream that is water. Reported fluid rates are total liquid and therefore include this fraction.
- Flow Rate (stbpd) — Surface liquid rate in stock-tank barrels per day at standard conditions.
- Flowing Bottomhole Pressure (psia) — Measured bottomhole pressure under producing conditions, corrected to mid-perforation depth.
- Bubble Point Pressure (psia) — Pressure at reservoir temperature where the first gas bubble comes out of solution; obtained from PVT data or assumed to be standard conditions (e.g., 14.65 psia).
1.3. Vogel’s Two Rate Test Data
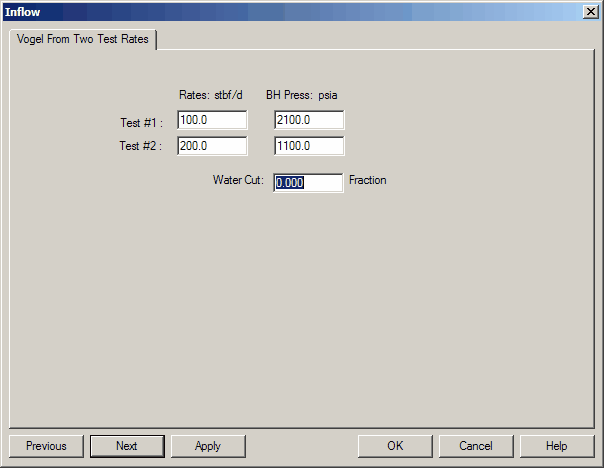
- Water Cut (fraction) — Portion of the total liquid stream that is water. Reported fluid rates are total liquid and therefore include this fraction.
- Flow Rate (stbpd) — Surface liquid rate in stock-tank barrels per day at standard conditions.
- Flowing Bottomhole Pressure (psia) — Bottomhole pressure measured under producing conditions, corrected to mid-perforation depth.
1.4. Fetkovich from Multipoint Test Data
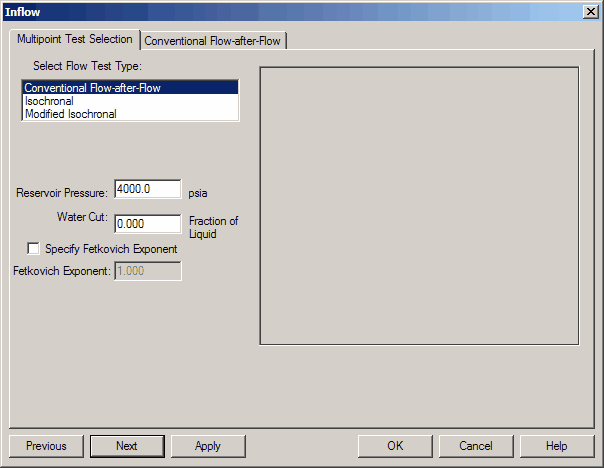
The multipoint data are fit to the empirical backpressure (Fetkovich) relationship:
- Reservoir Pressure (psia) — Average pressure for the well’s drainage area (e.g., from buildup analysis). This method applies a single reservoir-pressure value to all zones.
- Water Cut (fraction of liquid) — Fraction of the total liquid stream that is water. Reported fluid rates are total liquid, which include this fraction.
-
Fetkovich Exponent — The data is ultimately fit to the backpressure equation
- — Empirical backpressure coefficient (units depend on and the chosen units for and ).
- — Average reservoir pressure (psia).
- — Flowing bottomhole pressure (psia).
- — Dimensionless Fetkovich exponent obtained by fitting multipoint data.
Single reservoir pressure for all zones
This option uses one Reservoir Pressure value across all zones.
1.5. Fetkovich from C and
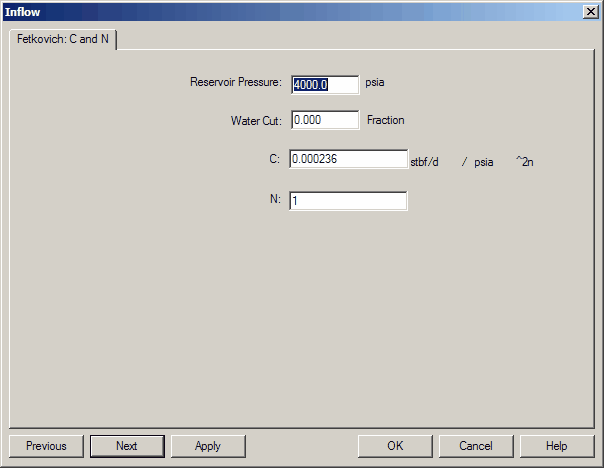
This option uses the Fetkovich backpressure relationship with user-supplied coefficients and .
- Reservoir Pressure (psia) — Average pressure in the drainage area (often from buildup analysis). This setting uses a single reservoir pressure for all zones.
- Water Cut (fraction) — Fraction of total liquid that is water. Reported total liquid rate includes this fraction.
1.6. Constant PI
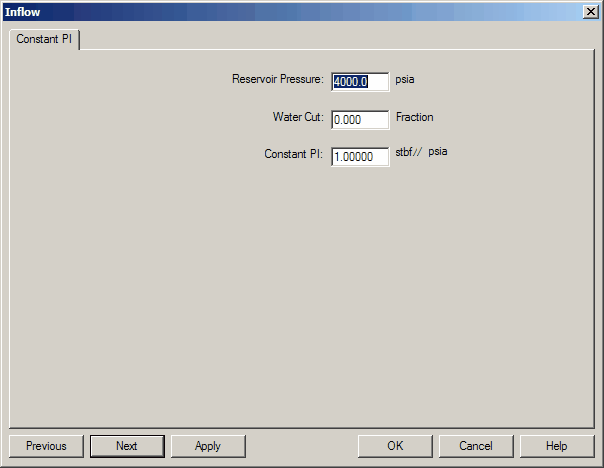
- RESERVOIR PRESSURE (psia): The average reservoir pressure in the well's drainage area and can be obtained from pressure buildup analysis. This option is limited to one reservoir pressure for all zones.
- WATER CUT (Fraction): The fraction of the total liquid flow stream that is made up of water. In the results, fluid rate data is reported as TOTAL fluid which includes this water cut fraction.
- CONSTANT PI: The Productivity Index consists of the barrels of fluid produced per change in bottomhole pressure (i.e. delta p).
1.7. Constant PI from Fluid Level
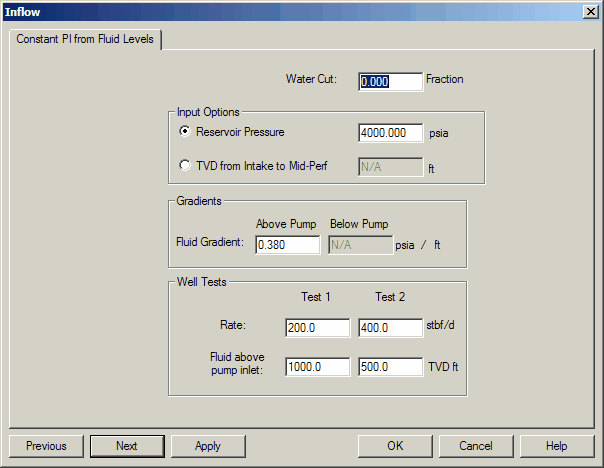
You can enter IPR data from fluid levels in two ways:
-
Option 1 — Reservoir pressure + two fluid levels.
Provide a reservoir pressure and two fluid-level measurements. The IPR curve will intersect the pressure axis at the given reservoir pressure, and its decline is set by the PI computed from the two test points. The absolute pressures from those two points are not used, since the intercept must match the reservoir pressure.- RESERVOIR PRESSURE (psia) — Average reservoir pressure in the well’s drainage area; typically obtained from pressure buildup analysis. One reservoir pressure is used for all zones.
-
Option 2 — Actual fluid levels with depth and gradient.
Supply accurate fluid levels so absolute pressures can be calculated. Enter the depth from the pump intake to the mid-point perforation (MPP) and the fluid gradient below this point. Note: gradients above the pump intake are usually 100% oil even at high water cut, while the gradient from intake to perforations reflects producing fractions.-
FLUID GRADIENT BELOW THE PUMP INTAKE (psi/ft) — Annulus gradient from: where is fluid gradient and is fluid density.
-
DEPTH FROM INTAKE TO MPP — TVD distance from the pump intake to the perforation mid-point used to correct pump-intake pressures to flowing bottomhole pressure.
-
Common Entries:
- WATER CUT — Fraction of total liquid that is water. Reported fluid rate is total liquid and includes this water fraction.
- FLUID GRADIENT ABOVE THE PUMP (psi/ft) — The fluid gradient in the annulus obtained from Eq. 3, Where is the fluid gradient (psi/ft) and is the fluid density (lb/cubic ft).
- FLOW RATE (mscfd or stbpd) — Surface production rate at standard conditions.
- FLUID LEVEL (ft) — Annulus fluid level as TVD from the pump intake to the top of the fluid interface. Obtain by shooting a fluid level (e.g., acoustic device such as Echometer) and subtracting from depth to pump intake. Definition updated in June 1994 to reflect field data.
1.8. Babu & Odeh Horizontal Model

- Reservoir Pressure (psia) — Average reservoir pressure within the well’s drainage area; typically from pressure-buildup analysis.
- Water Cut — Fraction of total liquid that is water; reported results are total fluid and therefore include this water fraction.
- Reservoir Temperature (°C) — Bottomhole temperature at reservoir depth, from direct measurement or estimated using the local geothermal gradient with surface temperature.
- Wellbore Radius (ft) — From caliper log or bit size when washout isn’t present. “Wellbore Radius Examples” may be used as a guideline.
- Net Thickness (ft) — Thickness of the productive interval; usually from well logs and should be consistent with the permeability used.
- Skin Factor — Dimensionless indicator of near-wellbore condition: positive = damage, negative = stimulation. Derived from drawdown/buildup analysis; includes completion effects (e.g., horizontal wellbore, perforation density, gravel pack).
- Permeability (md) — Absolute (fluid-independent) permeability averaged over net thickness. Commonly from core (air) measurements; effective (fluid-dependent) values from pressure transient analysis can be converted to absolute.
- X direction — Perpendicular to the well’s axis.
- Y direction — Along the well’s axis.
- Z direction — Vertical, perpendicular to bedding.
- Drainage Length (ft) — Length of the approximate rectangular area drained along the horizontal section.
- Drainage Width (ft) — Width of the approximate rectangular area drained across the well path.
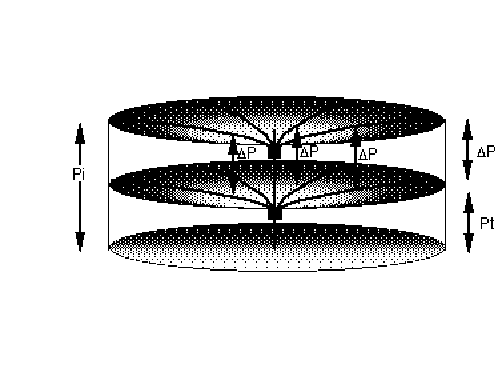
- Well Dist to || Side x0 (ft) — Labeled “x0” on the figure; offset of the well axis from the side parallel to the horizontal path. Near zero if drilled along an edge (e.g., a fault); equals ½ of Drainage Width if centered.
- Well Dist to Top z0 (ft) — Labeled “z0” on the figure; offset of the well axis down from the top along the horizontal path. Near zero if along the top/bottom; equals ½ of Net Height if centered. Gravity effects are ignored, so use the smaller distance to top or bottom.
- Heel Dist to Heel End y1 (ft) — Labeled “y1” on the figure; offset from the heel of the drainage area to the heel of the well. Near zero if the well enters at the boundary and proceeds away; equals ½ of (Drainage Length − Well Length) if centered.
- Horizontal Section Length z0 (ft) — Labeled “L” on the figure; drilled length of the horizontal wellbore assuming uniform formation from heel to toe. In practice this can differ; it’s often adjusted to match performance, though with limited technical basis.
1.9. Hydraulically Fractured Oil IPR

- Reservoir Pressure (psia) — Average reservoir pressure in the well’s drainage area; typically from pressure-buildup analysis.
- Water Cut (frac) — Fraction of total liquid that is water; results report total fluid and include this water fraction.
- Reservoir Permeability (md) — Absolute (fluid-independent) permeability averaged over net thickness. Commonly from core (air) measurements; effective (fluid-dependent) values from transient analysis can be converted to absolute.
- Wellbore Radius (ft) — From caliper log or bit size when washout is not an issue (see “Wellbore Radius Examples”).
- External Radius (ft) — Distance to the no-flow boundary set by offset wells.
- Net Thickness (ft) — Thickness of the interval contributing to flow; usually from well logs and consistent with the permeability used.
- Skin Factor — Dimensionless indicator of near-wellbore condition: positive = damage, negative = stimulation. From drawdown/buildup analysis; includes completion effects (horizontal wellbore, perforation density, gravel pack, etc.).
- Fracture 1/2 Length (ft) — Distance from wellbore to a single fracture wing tip. Part of the design; can be estimated from transient tests. Typical range: 50–1000 ft.
- Porosity (fraction) — Used in the storativity term of the fracture IPR; lower porosity yields lower rates.
- Producing Time (days) — Time the well has produced with the current fracture. Because the model is transient, results depend on the evaluation time. Short times give high rates (linear model,
tdxf < 0.016); longer times trend toward Darcy/quadratic models. A discontinuity can exist between models due to parameter independence in the pseudo-steady-state model. - Total Compressibility (1.e−6) — Total system compressibility for storativity terms. Typical:
20(oil) or500(gas), with theE−6assumed (i.e., enter20for oil,500for gas). - Fracture Width (in.) — Fracture aperture; design value or from transient tests. Typical range: 0.1–0.4 in.
- Fracture Permeability (md)
- Fracture Conductivity (md) — Permeability of the propped fracture, mainly a function of proppant type and any degradation. See “Gravel Permeability Examples.”
1.10. User IPR Table — Oil
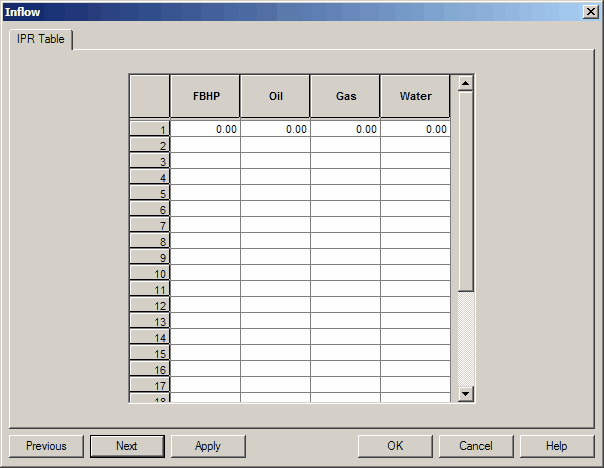
This table allows user-defined IPR behavior to be used within SNAP. No IPR calculations are performed on these values, except for mathematically supplementing points to enable reasonable hydraulics curve intersection calculations.
2. Gas IPR Options
- Quadratic Flow Equation — IPR generated with the quadratic flow equation to capture turbulence; calculations use real-gas pseudo-pressure to handle pressure-dependent viscosity and Z-factor.
- Multipoint Flow Test — Uses the back-pressure equation and test data to produce current and predicted performance.
- Back Pressure C and N — Builds the IPR from user-supplied back-pressure coefficients; in some areas these are fixed by regulators so you can lock specific values.
- Babu & Odeh Horizontal Well Model — Implements the Babu–Odeh method for horizontal wells, including position within the drainage area; supersedes simpler models.
- Fractured Well Model — Uses the linear flow equation at very early times, or a quadratic form with modified for pseudo-radial late time (). See SPE Monograph 12 Recent Advances in Hydraulic Fracturing, pp. 325–331. This model is transient and time-dependent.
- Gas Deliverability with Non-Darcy Skin Factor — For high-rate/low-pressure gas completions where near-wellbore irreversible losses bend the IPR downward at high rates. Total skin includes mechanical plus non-Darcy terms expressed as (units of are units of ); typical . Ref: Lee & Wattenbarger, Gas Reservoir Engineering, p.117.
- User Defined IPR Model — Enter a custom IPR when none of the above models adequately describe the well behavior.
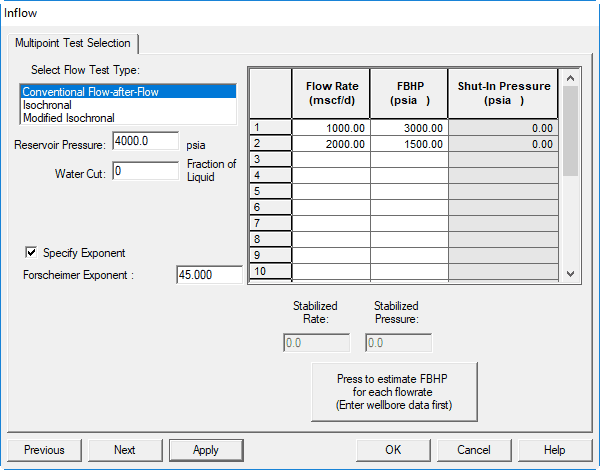
2.1. Multi-Point Flow Test
The IPR is generated by fitting multi-point (deliverability) test data to a quadratic equation. Test procedures can be conventional, isochronal, or modified isochronal. Because this option uses measured flowing bottomhole pressure to build the IPR, the completion pressure drop is implicitly included and cannot be calculated separately.
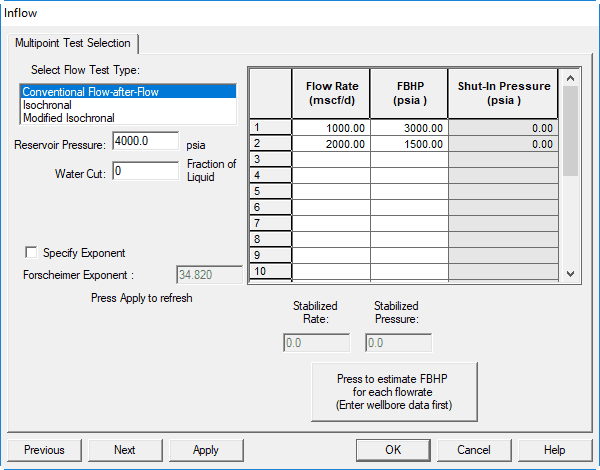
If the non-Darcy exponent is known, select the option to enter it directly instead of calculating it.
Inputs
- Test Type — Select the multipoint test type, enter reservoir pressure, then click OK to see the test-specific inputs.
- Reservoir Pressure (psia) — Average reservoir pressure in the well’s drainage area (from pressure-buildup analysis). One value applies to all zones.
- Water Cut (frac) — Fraction of total liquid that is water. Results report total fluid, which includes this fraction.
Test definitions
- Conventional Flow After Flow Test — Flow at two or more rates to stabilization at each rate; record reservoir pressure, stabilized rate, and flowing bottomhole pressure for each period.
- Isochronal Test — Two or more (usually four) equal-duration flow periods at different rates, each followed by an extended shut-in to approach average reservoir pressure; the final rate is extended to stabilization.
- Modified Isochronal Test — Two or more (usually four) sequences of equal-duration flow and shut-in, followed or preceded by extended flow and shut-in to obtain stabilized flowing pressure and reservoir pressure.
2.1.1. Conventional Flow After Flow
UI change
This grid has been moved to the main Multi-Point Selection panel for a simpler interface. The column descriptions below are still accurate.
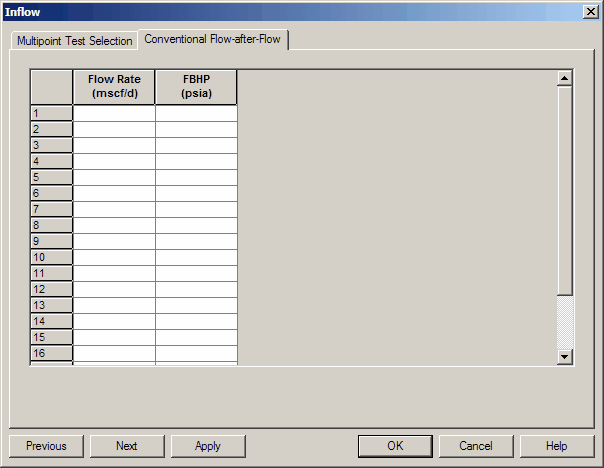
Inputs
- Flow Rate (mscfd or stbpd) — Surface production rate at standard conditions. Each rate should be taken after the well stabilizes and flowing bottomhole pressure is constant.
- Flowing Bottomhole Pressure (psia) — Measured bottomhole pressure under flowing conditions, corrected to mid-perforation depth.
2.1.2. Isochronal Test
UI change
This grid has been moved to the main Multi-Point Selection panel. The column and cell descriptions below remain accurate.
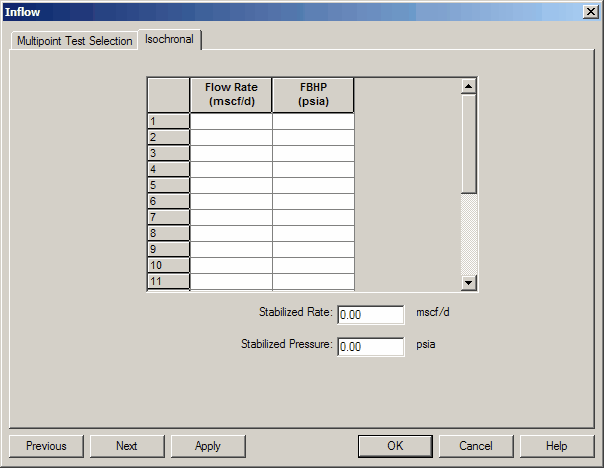
Inputs
- Flow Rate (mscfd or stbpd) — Surface production rate at standard conditions.
- Flowing Bottomhole Pressure (psia) — Measured under flowing conditions; correct to mid-perforation depth.
- Stabilized Flow Rate (mscfd or stbpd) — Surface rate at standard conditions after the well stabilizes (FBHP constant).
- Stabilized Flowing Bottomhole Pressure (psia) — Flowing bottomhole pressure at the end of the extended flow period, corrected to mid-perforation depth.
2.1.3. Modified Isochronal Test
UI change
This grid has been moved to the main Multi-Point Selection panel. The column and cell descriptions below remain accurate.
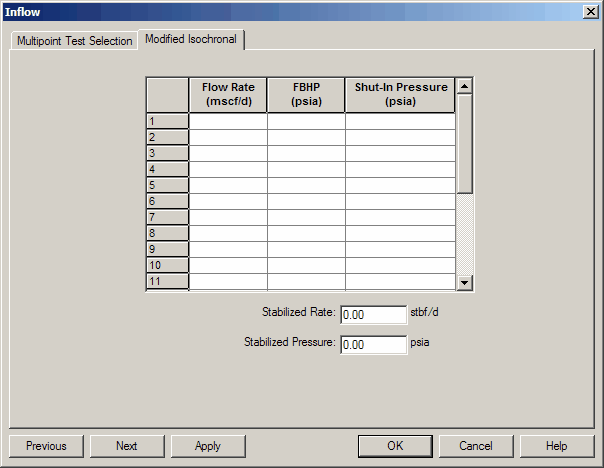
Inputs
- Flow Rate (mscfd or stbpd) — Surface production rate at standard conditions.
- Flowing Bottomhole Pressure (psia) — Measured under flowing conditions; correct to mid-perforation depth.
- Shut-In Bottomhole Pressure (psia) — Static bottomhole pressure; correct to mid-perforation depth.
- Stabilized Flow Rate (mscfd or stbpd) — Surface rate at standard conditions after the well stabilizes (FBHP constant).
- Stabilized Flowing Bottomhole Pressure (psia) — Flowing bottomhole pressure at the end of the extended flow period; correct to mid-perforation depth.
- Number of Test Points — For conventional tests, total number of rates used. For isochronal/modified isochronal, the count of transient flow periods (not including the stabilized rate). Must be >1 and <11.
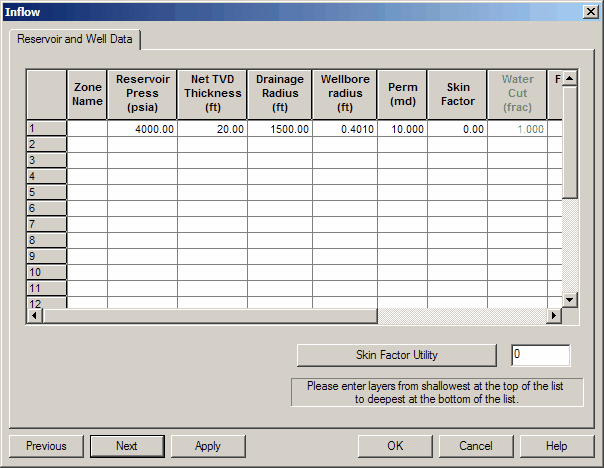
2.2. Quadratic Flow Equation
Inputs
- Zone Name — Identifier used when multiple layers or complex flow is expected.
- Reservoir Pressure (psia) — Average pressure in the well’s drainage area; typically from pressure buildup analysis.
- Net TVD Thickness (ft) — Net contributing thickness, usually from well logs; should align with the average permeability used.
- Drainage Radius (ft) — Distance to the no-flow boundary set by offset wells in a pattern.
- Wellbore Radius (ft) — From caliper log or bit size when washout isn’t an issue (see examples).
- Permeability (md) — Absolute (fluid-independent) permeability averaged over the net thickness; typically from air-core measurements. Effective (fluid-dependent) values from transient analysis can be converted to absolute.
- Skin Factor — Dimensionless measure of near-wellbore damage (+) or stimulation (−); obtained from drawdown/buildup analysis. Includes completion effects (e.g., horizontal wellbore, perforation density, gravel pack).
- Water Cut — Fraction of total liquid that is water. Results report total fluid rate, which includes this water fraction.
2.3. Back Pressure C and N
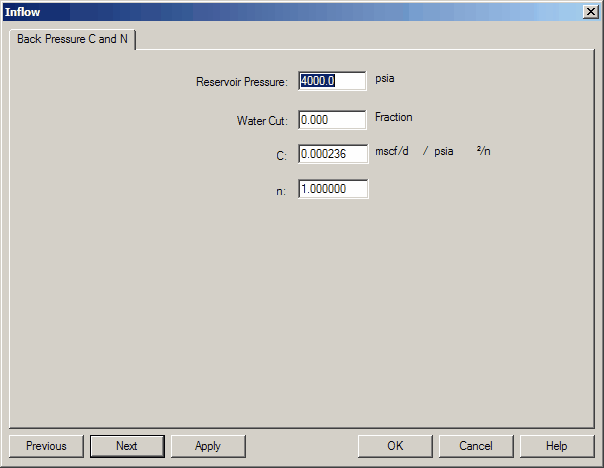
Inputs
- Reservoir Pressure (psia) — Average pressure in the well’s drainage area; typically from pressure buildup analysis. Limited to one reservoir pressure for all zones.
- Water Cut — Fraction of total liquid that is water. Results report total fluid rate, which includes this water fraction.

- C — Coefficient in the empirical IPR back-pressure equation:
- n — Exponent in the empirical IPR back-pressure equation:
2.4. Babu & Odeh Horizontal Model
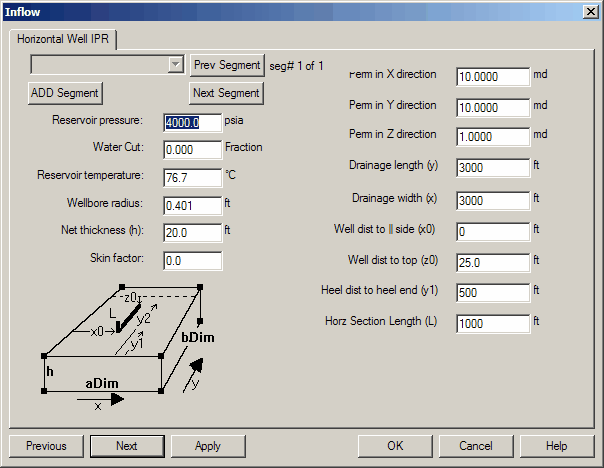
Inputs
- Reservoir Pressure (psia) — Average pressure in the well’s drainage area; typically obtained from pressure buildup analysis.
- Water Cut — Fraction of total liquid that is water. Results report total fluid rate including this fraction.
- Wellbore Radius (ft) — From caliper log, or drill bit size when washout isn’t an issue. Wellbore radius examples may be used as a guideline.
- Net Thickness (ft) — Thickness of the productive interval contributing flow; should align with the average permeability used.
- Skin Factor — Dimensionless indicator of near-wellbore condition (positive = damage, negative = stimulation); derived from drawdown/buildup analysis and includes completion effects (e.g., horizontal wellbore, perforation density, gravel pack).
- Permeability (md) — Absolute (fluid-independent) permeability averaged over net thickness; typically from core (air). Effective permeability from pressure transient analysis can be converted to absolute values.
- X direction — Perpendicular to the well axis.
- Y direction — Along the well axis.
- Z direction — Vertical (perpendicular to bedding).
- Drainage Length (ft) — Length of the approximate rectangular area drained along the horizontal well.
- Drainage Width (ft) — Width of the approximate rectangular area drained across the well path.
- Well Dist to ∥ Side, x₀ (ft) — Labeled “x₀” in the figure; offset of the well axis from the side parallel to the horizontal path. Near zero if along an edge; equals ½ of Drainage Width if centered.
- Well Dist to Top, z₀ (ft) — Labeled “z₀”; offset down from the top along the horizontal path
2.5. Darcy with Non-Darcy Dq Skin
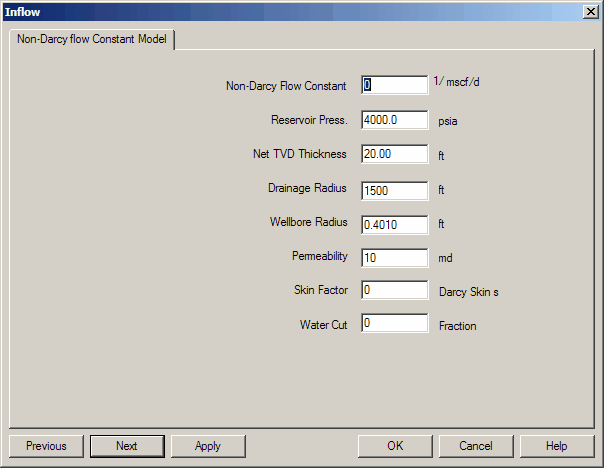
Inputs
- Non-Darcy Flow Constant (1/mscfpd) — Empirical parameter linking the variable portion of skin to rate; can also be estimated from equations (see Lee & Wattenbarger, Gas Reservoir Engineering, p.117).
- Reservoir Pressure (psia) — Average pressure in the well’s drainage area; typically obtained from pressure buildup analysis.
- Permeability (md) — Absolute (fluid-independent) permeability averaged over the net thickness; often measured on core with air. Effective permeability from transient analysis can be converted to absolute.
- Wellbore Radius (ft) — From caliper log or drill bit size when washout isn’t an issue. Wellbore radius examples may be used as a guideline.
- External Radius (ft) — Distance to the no-flow boundary set by spacing. Equal to one half the square root of the well spacing.
- Net Thickness (ft) — Thickness of the zone believed to contribute flow; should align with the specified average permeability.
- Skin Factor — Dimensionless indicator of near-wellbore condition (positive = damage, negative = stimulation); obtained from drawdown/buildup analysis and includes completion effects (horizontal wellbore, perforation density, gravel pack, etc.).
- Water Cut — Fraction of total liquid that is water. Results report TOTAL fluid, which includes this fraction.
2.6. Hydraulically Fractured Gas IPR

Inputs
- Reservoir Pressure (psia) — Average pressure in the well’s drainage area; typically obtained from pressure buildup analysis.
- Permeability (md) — Absolute (fluid-independent) permeability averaged over the net thickness; often measured on core (air). Effective permeability from transient analysis can be converted to absolute values.
- Wellbore Radius (ft) — From caliper log, or drill bit size when washout isn’t an issue. Wellbore radius examples may be used as a guideline.
- External Radius (ft) — Distance to the no-flow boundary set by spacing.
- Net Thickness (ft) — Thickness of the interval believed to contribute flow; should align with the average permeability used.
- Skin Factor — Dimensionless indicator of near-wellbore condition (positive = damage, negative = stimulation); derived from drawdown/buildup analysis and includes completion effects (horizontal wellbore, perforation density, gravel pack, etc.).
- Fracture Half-Length (ft) — Distance from the wellbore to the tip of one fracture wing. Typically 50–1000 ft; can be estimated from transient tests after treatment.
- Porosity (fraction) — Used in storativity terms for the fracture IPR; lower porosity yields lower rates.
- Producing Time (days) — Time on production with the current fracture. Because this is a transient model, results depend on time: early time follows linear flow (); later time transitions to Darcy/quadratic (pseudo-radial) behavior. A small discontinuity may appear between models due to differing parameter dependencies in the pseudo-steady formulation.
- Total Compressibility (1e–6) — Total system compressibility used in storativity terms. Typical inputs: 20 (oil systems) and 500 (gas systems); the entry assumes the ×10⁻⁶ factor (i.e., enter 20 or 500).
- Fracture Width (in.) — Fracture aperture; design value or estimated from transient tests. Typical range 0.1–0.4 in.
- Fracture Conductivity (md) — Property of the propped fracture primarily governed by proppant type and degradation; typical values are available from gravel/permeability examples.
2.7. User IPR Table – Gas

This table allows user-defined gas IPR behavior to be used in SNAP. No IPR calculations are performed on these entries, except to mathematically supplement the set of points to enable reasonable intersections with the hydraulics curve.
3. Water Injector IPR Options
The following IPR types are available for a water injector well:
3.1. Darcy Injectivity — Water
Inputs
- Reservoir Pressure (psia) — Average reservoir pressure in the well’s drainage area; typically from pressure buildup analysis.
- Net TVD Thickness (ft) — Thickness of the interval contributing flow; should be consistent with the average permeability used.
- Drainage Radius (ft) — Distance from the well to the no-flow boundary created by offset wells.
- Wellbore Radius (ft) — From caliper log, or drill bit size when washout isn’t an issue. Wellbore Radius Examples may be used as a guideline.
- Permeability (md) — Absolute (fluid-independent) permeability averaged over net thickness; typically from core (air). Effective permeability from pressure transient analysis can be converted to absolute values.
- Skin Factor — Dimensionless indicator of near-wellbore condition (positive = damage, negative = stimulation); derived from drawdown/buildup analysis and includes completion effects (e.g., horizontal wellbore, perforation density, gravel pack, etc.).
- Water Cut — Fraction of total liquid that is water. Results report total fluid rate including this fraction.
- Fracture Pressure (psia) — Pressure at which the injectivity slope changes as the reservoir begins to break down. Typical fracture gradients: 0.7–1.2 psi/ft.
- Max Rate (bwpd) — Upper bound for injectivity calculations. Enter the highest anticipated injection rate; the tool generates points from 0 to this value. Very large values ensure a valid intersection but may reduce IPR curve resolution.
- Post-Frac Skin — Skin factor after fracturing; should be less than the pre-frac skin.
- Choke
3.2. Water Injectivity Index
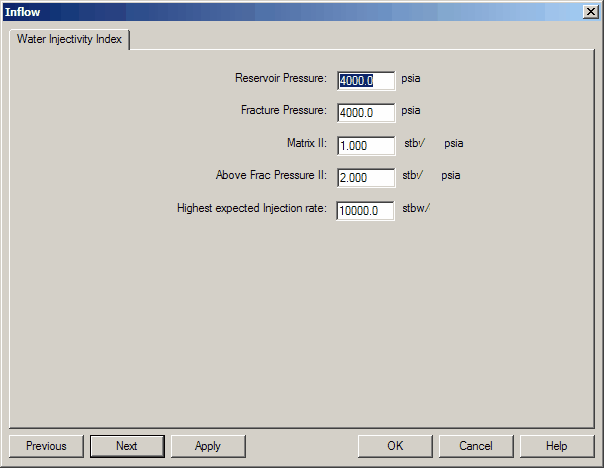
Inputs — Fractured Reservoir Data panel
- Reservoir Pressure (psia) — Average reservoir pressure in the well’s drainage area; typically from pressure buildup analysis.
- Fracture Pressure (psia) — Pressure at which the injectivity slope changes as the reservoir begins to break down. Typical fracture gradients: 0.7–1.2 psi/ft TVD.
- Matrix II (bw/psi) — Injectivity index of the formation prior to fracturing.
- Above Frac II (bw/psi) — Injectivity index of the formation after fracturing; should be greater than the below-frac II.
- Highest Expected Injection Rate (bwpd) — Sets an upper bound for injectivity calculations. Enter the highest anticipated injection rate; the tool generates points from 0 to this value. Very large values help ensure a valid intersection but may reduce IPR curve resolution.
3.3. User IPR Table — Water

This table allows user-defined IPR behavior to be used within SNAP. No IPR calculations are performed on these entries, except to mathematically supplement the total number of points to enable reasonable hydraulics-curve intersection calculations.
4. Gas Injector IPR Options
The following IPR Types are available for a Gas Injector Well:
4.1. Darcy Injectivity — Gas

Inputs
- Reservoir Pressure (psia) — The average reservoir pressure in the well’s drainage area; typically obtained from pressure buildup analysis.
- Net TVD Thickness (ft) — Thickness of the productive interval contributing flow; should align with the average permeability used.
- Drainage Radius (ft) — Distance from the well to the no-flow boundary created by offset wells. See Drainage Area Examples.
- Wellbore Radius (ft) — From caliper log, or drill bit size when hole washout isn’t an issue.
See Wellbore Radius Examples. - Permeability (md) — Absolute (fluid-independent) permeability averaged over net thickness; typically from core (air). Effective permeability from pressure transient analysis can be converted to absolute values.
- Skin Factor — Dimensionless indicator of near-wellbore condition (positive = damage, negative = stimulation); derived from drawdown/buildup analysis and includes completion effects (e.g., horizontal wellbore, perforation density, gravel pack).
- Water Cut — Fraction of total liquid that is water. Results report total fluid rate including this fraction.
- Fracture Pressure (psia) — Pressure at which the injectivity slope changes as the reservoir begins to break down. Typical frac gradients: 0.7–1.2 psi/ft.
- Max Rate (mscfpd) — Highest anticipated injection rate. IPR points are generated from 0 to this value; very large inputs ensure a valid intersection but may reduce IPR-curve resolution.
- Post-Frac Skin — Skin factor after fracturing; should be less than the below-frac skin.
- Choke
4.2. Back Pressure II
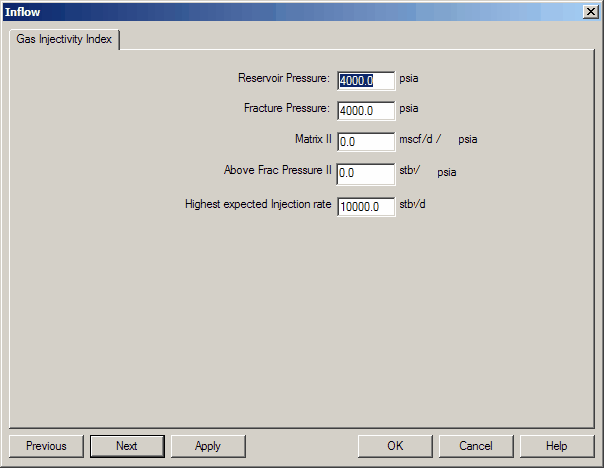
Editable fields (Fractured Reservoir Data panel)
- Reservoir Pressure (psia) — Average reservoir pressure in the well’s drainage area; typically obtained from pressure buildup analysis.
- Fracture Pressure (psia) — Pressure at which the injectivity index slope changes as the reservoir begins to break down. Typical frac gradients: 0.7–1.2 psi/ft.
- Matrix II (mscfpd/M(p)) — Injectivity index before fracturing (mscfpd per change in real-gas pseudopressure).
- Above Frac II (mscfpd/M(p)) — Injectivity index after fracturing; should be greater than the below-frac II value (mscfpd per change in real-gas pseudopressure).
- Highest Expected Injection Rate (mscfpd) — Sets the upper bound for injectivity calculations; points are generated from 0 to this value. Very large entries ensure an intersection but can reduce IPR-curve resolution.
4.3. Gas II (psi)
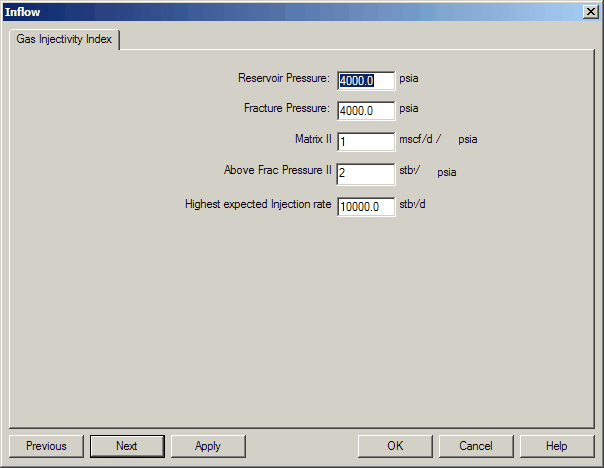
Editable fields (Fractured Reservoir Data panel)
- Reservoir Pressure (psia) — Average reservoir pressure in the well’s drainage area; typically obtained from pressure buildup analysis.
- Fracture Pressure (psia) — Pressure at which the injectivity index slope changes as the reservoir begins to break down. Typical frac gradients: 0.7–1.2 psi/ft.
- Matrix II (mscfpd/M(p)) — Injectivity index before fracturing (mscfpd per change in real-gas pseudopressure). Although rigorous, these units may be unfamiliar to many engineers.
- Above Frac II (mscfpd/M(p)) — Injectivity index after fracturing; should be greater than the below-frac II value (mscfpd per change in real-gas pseudopressure).
- Highest Expected Injection Rate (mscfpd) — Sets the upper bound for injectivity calculations; points are generated from 0 to this value. Very large entries ensure an intersection but can reduce IPR-curve resolution.
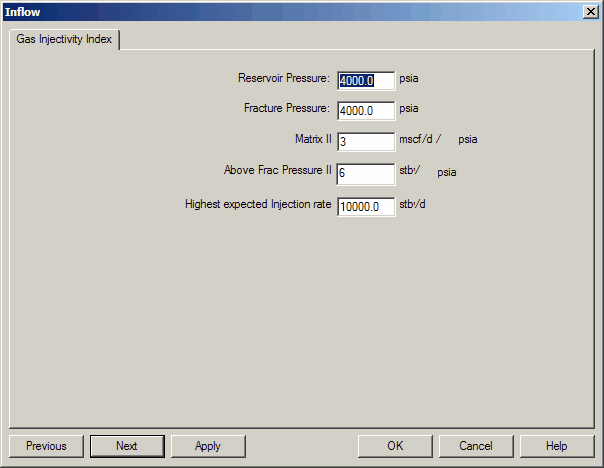
4.4. Gas II (psi²)

Editable fields (Fractured Reservoir Data panel)
- Reservoir Pressure (psia) — Average reservoir pressure in the well’s drainage area; typically obtained from pressure buildup analysis.
- Fracture Pressure (psia) — Pressure at which the injectivity index slope changes as the reservoir begins to break down. Typical frac gradients: 0.7–1.2 psi/ft.
- Matrix II (mscfpd/M(p)) — Injectivity index before fracturing (mscfpd per change in real-gas pseudopressure). Although rigorous, these units may be unfamiliar to many engineers.
- Above Frac II (mscfpd/M(p)) — Injectivity index after fracturing; should be greater than the below-frac II value (mscfpd per change in real-gas pseudopressure).
- Highest Expected Injection Rate (mscfpd) — Sets the upper bound for injectivity calculations; points are generated from 0 to this value. Very large entries ensure an intersection but can reduce IPR-curve resolution.
4.5. Gas II (M(p))
Editable fields (Fractured Reservoir Data panel)
- Reservoir Pressure (psia) — Average reservoir pressure in the well’s drainage area; typically obtained from pressure buildup analysis.
- Fracture Pressure (psia) — Pressure at which the injectivity index slope changes as the reservoir begins to break down. Typical frac gradients: 0.7–1.2 psi/ft.
- Matrix II (mscfpd/M(p)) — Injectivity index before fracturing (mscfpd per change in real-gas pseudopressure). Although rigorous, these units may be unfamiliar to many engineers.
- Above Frac II (mscfpd/M(p)) — Injectivity index after fracturing; should be greater than the below-frac II value (mscfpd per change in real-gas pseudopressure).
- Highest Expected Injection Rate (mscfpd) — Sets the upper bound for injectivity calculations; points are generated from 0 to this value. Very large entries ensure an intersection but can reduce IPR-curve resolution.
4.6. User IPR Table — Gas Injector

This table allows user-defined IPR behavior within SNAP. No IPR calculations are performed on these values, except to mathematically supplement the number of points so hydraulics–curve intersections can be computed reasonably.